Low-week (cyclic) fatigue failure is one of the important damage forms of pressure vessels. Under cyclic loading, microcracks will appear in the local high stress area of the pressure vessel, and with the load action the microcracks keep expanding to form macro fatigue cracks, which leads to fatigue failure of the vessel. In order to guarantee the safety and reliability of the pressure vessel, a systematic study of the material activation sliding law is needed. In this paper, S32750 duplex stainless steel is subjected to tensile experiments, low-cycle fatigue tests, combined with X-ray spectroscopy to analyse the cyclic stress response, cyclic stress-strain behaviour, cyclic stress-strain hysteresis curves to obtain the low-cycle fatigue performance, and the crack tip cyclic plastic zone strain distribution performance is obtained by DIC analysis. The results show that the fatigue life of the test steel is extended by more than 87% with the increase of solid solution temperature, and the duplex stainless steel shows a linear relationship with the increase of grain size level and the number of cycle cycles. In addition, the crack tip equivalent strain during the whole fatigue crack extension process is basically the same with the fatigue crack length and the number of cycles.
The control of steel flow in the steel tank during the casting process directly affects the normal operation of production and the quality of cast billets [1]. Before the 1970s, almost all of the plug rod device control, the method of poor process performance, steel ladle steel flow is not easy to control, after the 1970s, plug rod flow control is gradually replaced by the sliding mechanism device, sliding mechanism of the use of the reliability of a greater improvement in the refractory material has also been a major change [2-4]. Sliding mechanism of the form of different production organizations and different, steel tank sliding system of steel leakage accidents also occur from time to time, light casting stop pouring, heavy burn casting equipment or cause greater losses [5,6]. Three steel leakage accidents occurred in the third steelmaking plant of Jigang in the three years of commissioning, affecting the smooth progress of production [7]. Therefore, it is of great practical significance to discuss the causes and preventive measures of steel leakage accidents in steel tank sliding system. Cast steel sliding system structure is the upper sliding plate brick fixed in the frame of the organization, the lower sliding plate brick and the lower spout brick installed in the drag plate [8,9]. The drag plate is controlled by hydraulic cylinder to slide back and forth. Slide so that the upper and lower sliding plate brick holes square or staggered, to complete the purpose of opening or closing the pouring. After assembly, the upper and lower face contact of the two sliding plate by the spring pressure to complete, that is, in the process of sliding plate brick movement, due to the action of the spring, so that the two bricks closely match [10-13].
The assembly of the sliding mechanism and the installation of the supporting refractory material is done in the pre-assembly area of the steel water tank. Before installation, the surface of the upper spout bricks was cleaned of mud and care was taken not to damage the surface of the bricks [14,15]. The mud and debris in the mechanism frame were cleaned with a wire brush and blown clean with compressed air. To avoid heat-shock cracking of the refractory material, do not blow compressed air onto the surface of the hot top spout. After the drag plate is installed, press around it by hand to ensure that the drag plate rests smoothly in the mechanism, and then install the lower down plate bricks [16,17]. If the lower slide tile is checked for wobbling, reinstall it. Also note that the surface of the installed lower slide tile should be kept clean. Put the slide plate brick into the mechanism first trial installation, check the cooperation between the slide plate brick and the mechanism, and measure the gap between the upper spout brick and the upper slide plate brick to keep within 2-3mm [18,19]. Then remove the bricks, apply special mud about 4 to 5 mm, and apply anti-bonding graphite emulsion on the surface of the mud, rotate the eccentric wheel of the gripper to fix the upper skateboard bricks. Finally, quickly close the slide plate door of the mechanism [20,21].
In this paper, 20mm hot rolled plate as raw material, change the solid solution temperature in order to prepare different test steels, tensile experiments and low cycle fatigue experiments, to explore the heat treatment process changes in the S32750 duplex stainless steel grain size, strain amplitude and strain rate of the test material under the conditions of low-cycle fatigue, the duplex stainless steel activation of the sliding properties. Finally, a fatigue test crack extension test was carried out on duplex stainless steel, and the strain distribution in the cyclic plastic zone at the crack tip was obtained by DIC analysis. Then combined with the crack tip stress-strain field calculation to get the crack tip cyclic plastic zone stress distribution, calculated to get the crack tip cyclic plastic zone plastic strain energy, to obtain the duplex stainless steel activated sliding law.
The study of the fatigue behaviour of duplex stainless steel mainly focuses on the location of the surface persistent slip band (PSB) and microcrack sprouting in the two phases, the change of dislocation structure in the two phases, and the effect of the different contents of the two phases on the fatigue performance. Low week (cyclic) fatigue is characterised by a large strain load during the fatigue test, resulting in cyclic stresses on the material exceeding its own yield strength, so that the material is dominated by plastic strains, and elastic strains account for a very small proportion of the deformation of the specimen, which is almost not considered. Material in the fatigue testing machine operation process, by the cyclic load, in a grain boundary due to the continuous accumulation of dislocations appear stress concentration or strain concentration phenomenon, which leads to the material will produce a large cyclic plastic deformation. As the fatigue test progresses, a crack source begins to appear in the material, which slowly expands to a critical value and eventually fatigue fracture occurs. Multiple parallel tests are usually done to find the fatigue behaviour of the material in a large amount of test data.
The test steel was Otto Kemp’s S32750 duplex stainless steel billet (weighing about 40kg) supplied by Zhejiang Jiu Li, with dimensions of about 180mm × 200mm. it was forged by Hebei Forging Plant into 115mm × 45mm × 245mm (4 pieces), and then trimmed to a thickness of 40mm for subsequent tests. The subsequent rolling was done by China Steel Zhuozhou Rolling Base. The thickness of 40mm plate was rolled to 20mm through 3 passes, the plate was heated to 1200℃ and held for 2h before rolling, the deformation of the 3 passes was 25%, 20% and 15% respectively, and the final rolling temperature was not lower than 1000℃. The chemical composition of the plate after rolling is shown in Table 1. The microstructure of the steel is a single-phase austenitic organisation with a grain size of about 122.8 , and a ferrite content of about 15% [22]. Five different solid solution temperatures (1050, 1075, 1100, 1150, 1175) were designed with 1050°C as the minimum temperature, with a continuous holding time of 40 min after 15 min of through-holding and water cooling.
| C | 0.022 | Cr | 25.22 |
| Si | 0.35 | Ni | 6.25 |
| Mn | 0.65 | Cu | 0.15 |
| P | 0.21 | Mo | 3.95 |
| S | \(\mathrm{<}\)0.0004 | N | 0.33 |
The tensile test was carried out according to the standard ASTM E8 ‘Tensile Test Methods for Metallic Materials’ on DDL50 electronic universal testing machine, the specimen size is shown in Figure 1, the test was carried out in room temperature and atmospheric environment, the tensile scale distance was 30 mm, and the strain rate was 1 \(\mathrm{\times}\) 10-3 s. In order to avoid test errors, at least 3 specimens were used for tensile property testing.

The specimens for the low-fatigue test were all taken in the main sheet metal channel along the axial direction by wire-cutting, and the specimen sizes were the same as those shown in Figure 1, and the test was carried out in room temperature and atmospheric environment according to the ASTM E606/E606M-1 ‘Method for Low-Fatigue Tests with Strain Control’, and the test equipment was the MTS 809 fatigue testing machine. The whole fatigue test is controlled by total strain, waveform is triangular wave, loading strain ratio is -1, strain amplitude is 0.2%-1.0%, loading rate is \(\varepsilon\)= 4 \(\mathrm{\times}\) 10\({}^{-3}\)/s, loading frequency is calculated according to \(f=\varepsilon /\left(4\varepsilon _{a} \right)\), where \(\varepsilon _{a}\) is the total strain amplitude.
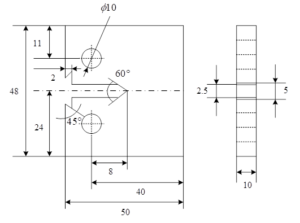
According to ASTM E647-11 “Fatigue Crack Expansion Rate Test Method”, fatigue crack expansion was performed using a CT standard specimen with the direction of crack expansion along the radial direction of the pipe, the specimen geometry as shown in Figure 2, and the specimen sheet was ground and mechanically polished. The fatigue crack extension tests were carried out on a MTS 810 fatigue testing machine. A sinusoidal alternating load was applied at room temperature with a frequency of 15 HZ. The crack length was measured by the DIC method, which is a photometric mechanical deformation measurement method, and during the fatigue crack extension test, the displacement and strain fields within the corresponding cycle can be obtained by continuously photographing the scattered images of the specimen surface within a certain cycle. The crack length is correlated with the crack tip strain field to observe the crack tip state during the whole fatigue crack extension process. Before the test, in order to eliminate the effect of wire cutting on the notch, the fatigue crack was prefabricated by the drop \(\Delta K\) method, and the length of the prefabricated crack was about 1.5 mm. To prevent the occurrence of overload phenomenon, the maximum stress intensity factor \(K_{\max }\) at the beginning of the experiment could not be greater than that at the end of the prefabricated crack.
Line cutting cut \(\Phi\)10mm metallographic specimen, with sandpaper from coarse to fine grinding step by step to 2000 #, and then 1.5\(\mu m\) diamond grinding paste for mechanical polishing to get a smooth mirror surface, and then electrolytic erosion (316LN duplex stainless steel erosion method: 60% of \(HNO_{3}\) erosion solution, DC voltage of 3V, time of about 50s. Z3CN-09M duplex stainless steel erosion method: \(30gNaOH+120mlH_{2} O\) erosion solution, DC voltage of 3V, time of about 10s. Erosion solution, DC voltage is 3V, time is about 10s), after erosion using CIKONG 4XCE optical microscope for metallographic observation.
The microstructure and fracture morphology of the samples were observed by scanning electron microscopy (SEM) After the experiments, the samples were intercepted near the fracture by wire cutting, and then the fracture was ultrasonically cleaned with acetone for 5 min, and the fracture morphology was observed using a field emission scanning electron microscope (FESEM) model ZEISS SUPRA55. The secondary electron imaging mode was used to observe the fracture morphology, and the backscattered electron imaging mode was used to observe the morphology of different atomic number phases in the alloy tissue.
X-ray energy spectroscopy (EDS for short), a technique that uses the characteristic X-rays generated to analyse the composition of second-phase particles, inclusions, etc. on the surface of a material [23]. Three types of scanning can be used to analyse the target area of the material: point scanning, line scanning and surface scanning, usually point scanning is used for inclusions and second phase particles of very small sizes, and line scanning or surface scanning is used for the material substrate.The EDS analysis is generally carried out qualitatively to determine the types of elements in the material, which is a crucial step, and then quantitatively to get the specific contents of different elements that and analysed to finally arrive at the type of compound.SEM is a technique for studying the surface morphology, composition, structure and other properties of a sample by scanning the surface of the sample and recording the resulting signals. XL30-FEG SEM was used to observe the metallographic microstructure of HNSS, the corrosion morphology after the kinetic potential polarisation curve, the corrosion morphology after immersion in Fe Cl3 solution, etc. EDS spectroscopy uses the X-rays emitted from the surface of the HNSS after excitation by an electron beam to analyse the elemental composition and content of the HNSS.
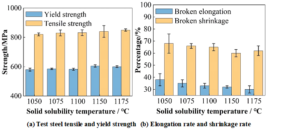
The tensile properties of the five test steels with different solid solution temperatures are shown in Figure 3, with (a) and (b) showing the tensile and yield strengths and the elongation and shrinkage of the experimental steels, respectively. With the increase of solid solution temperature, the yield and tensile strength of the experimental steels are increased, the yield strength is increased by about 7.27% of 39 MPa, while the tensile strength is increased by about 3.72% of 31.3 MPa, compared with the fluctuation of elongation and section shrinkage is larger, shrinkage decreases by about 12.32%, and elongation decreases by about 14.79%. Based on the duplex stainless steel matrix of the two-phase structure characteristics, solid solution temperature increases, the proportion of hard \(\alpha\)-phase in the matrix increases, the test steel will appear in a certain magnitude of strength, plastic toughness decline phenomenon.
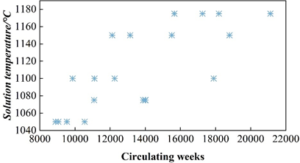
Normally, fatigue performance increases with strength, but this pattern does not coincide exactly with changes in steel grades. For example, in high-strength steels, their fatigue efficiency is low. Figure 4 shows the number of fatigue ruptures of different test steels. When the solid solution temperature is increased from 1050\(\mathrm{{}^\circ}\)C to 1175\(\mathrm{{}^\circ}\)C, the average number of fatigue ruptures of the test steels is increased from 9158 to 17288, which is an increase of more than 88.77%. As can be seen from Figure 3, the yield strength of the test steel is increased by 7.27%, and the tensile strength is only increased by 3.72%. Obviously, in duplex stainless steel, the fatigue life can not be explained only by the increase in strength, but also by the fatigue performance of the factors that influence the fatigue performance, which still need to be studied in more depth.
Three kinds of experimental steels, 1050, 1100 and 1150, were selected for hardness calculation, and Table 2 shows the hardness measurement data of the three experimental steels. From the table, we can know that the hardness of H1 is the largest, followed by H3, H2 hardness is the smallest, combined with the SEM microstructure analysis, the high hardness of H1 experimental steel is mainly due to its fine grains and contains more twins, H2 experimental steel grain is the most coarse, so the hardness is also the smallest, H3 experimental steel grain size in the middle of H1 and H2 experimental steel and contains a small number of twins, its hardness is greater than the H2 experimental steel is smaller than the H1 experimental steel.
| Experimental steel | H1 (1050) | H2 (1100) | H3 (1150) |
| Hardness (HV) | 205.2 | 168.7 | 195.3 |
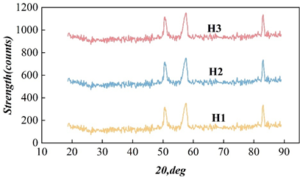
The newly developed experimental steel after solid solution process, for the austenite biphasic organisation is stable or not, it is necessary to analyse the physical phases of the three experimental steels by XRD, Figure 5 shows the XRD diffractograms of the three experimental steels. From the figure, it can be seen that the biphasic organisation of the experimental steels after the solid solution process is still a single austenitic organisation, and there is no transformation of other phases, which indicates that the austenitic organisation of the experimental steels is relatively stable.
The fracture of the tensile specimen is analysed, Figure 6 shows the EDS analysis of the tensile fracture of the experimental steel, in which it can be seen that the tensile fracture of the experimental steel are presented with greyish dark colour and no metallic luster, which is also a kind of toughness fracture performance characteristics, (a)\(\mathrm{\sim}\)(c) for the H1\(\mathrm{\sim}\)H3 EDS analysis diagram.
From the fracture of H1 experimental steel in Figure 6(a), it can be seen that there is a certain amount of ligamentous nest on the fracture of experimental steel, and the ligamentous nest is small and relatively deep, which belongs to the ligamentous nest fracture in ductile fracture, meanwhile, the fracture is relatively clean and no inclusions are observed near the ligamentous nest. In addition, by analysing the EDS pattern near the ligament fossa, it can be seen that there are no other inclusions in the fracture of the experimental steel, which indicates that the H1 experimental steel is relatively pure and has better tensile properties.
From the fracture of H2 experimental steel in Figure 6(b), it can be seen that the number of ligamentous nests on the fracture of the experimental steel is higher, but the ligamentous nests are large and shallow, which also belongs to the ligamentous nest fracture, and inclusions were found at the bottom of the ligamentous nests and in the vicinity of the ligamentous nests. EDS spectral analysis of these inclusions found that the inclusions in the section of H2 experimental steel are mainly a mixture of molybdenum, sulfur, manganese and carbon, and the bonding force between these inclusions and the matrix is weak, so when the experimental steel is subjected to external tensile stresses, microcracks are easily generated in these areas, and with the increase of the tensile stress and the gradual expansion of the final fracture.
Figure (c) in the H3 experimental steel fracture can be seen, H3 experimental steel fracture on the shear lip direction are consistent, H3 experimental steel is a shear fracture, the shear fracture is mainly due to plastic deformation caused by tensile stress, and gathered in the direction of the maximum shear force, resulting in a number of localised shear bands, with the increase in tensile stress these shear bands continue to expand, eventually leading to shear fracture. In addition, some inclusions were found on the section of H3 experimental steel, and through the EDS spectral analysis of the inclusions, it was found that the inclusions in H3 were mainly a mixture of silicon oxides and manganese, chromium, and carbon, which were conducive to cracking and reduced the toughness of the material. Analysing the tensile fracture EDS patterns of the three experimental steels shows that the H1 experimental steel has better tensile properties than the H2 and H3 experimental steels.
The size of the inclusions and other particles present in the experimental steels have a great influence on the size of the tough nests of the experimental steels after stretching. For some larger inclusions and particles are mostly in larger toughness nests, while the toughness of the experimental steel is larger and the size of inclusions and particles is uniform, then the formation of toughness nests of the experimental steel in tension is also more uniform. In addition, the size and distribution of the toughness of the nest is also related to the organisation and plasticity of the experimental steel itself, which is due to the experimental steel in some small holes in the connection will also be affected by the experimental steel itself plastic hardness. In general, the greater the strain hardening caused by the experimental steel in tension, the experimental steel will reduce the possibility of necking phenomenon, resulting in an increase in the number of small holes and gradually connected together, making the experimental steel in the ligamentous fossa become smaller and shallower.

The larger the grain size, the smaller the grain size, the more uniform grain distribution in the material, less likely to produce stress concentration phenomenon, thus reducing the probability of crack generation. A large number of tests have shown that grain size is an important factor affecting fatigue behaviour. In this section, low-cycle fatigue tests are conducted on specimens with different grain sizes to investigate the effect of grain size on low-cycle fatigue performance.
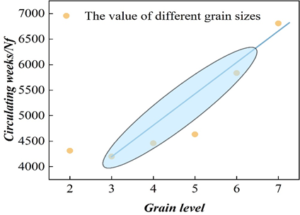
S32750 duplex stainless steel specimens with different grain sizes were subjected to strain-controlled low-cycle fatigue tests, the strain amplitude was 0.6%, the strain ratio was R=-1, the loading rate was 0.4%/s, and the cyclic waveform was a triangular wave, and three parallel specimens were selected for fatigue tests for each grain size test material, and the fatigue data were shown in Table 3. Different grain size test material in the table corresponding to the grain size and fatigue weekly data are linearly fitted as shown in Figure 7, to explore the quantitative relationship between the grain size level and fatigue weekly of S32750 duplex stainless steel.
From the figure, it can be seen that when the grain size level is 2, the cycle times of S32750 duplex stainless steel are more than those when the grain size level is 3. This is due to the fact that with the growth of solid solution temperature and solid solution time in the solid solution treatment test, a large number of regular annealed twins appear within the grains of the grain size of 2, which contributes to the formation of dislocation plugging, resulting in the increase in material strength and the prolongation of fatigue life. Grain size level within the level 3-7, with the increase of the grain size level, the cycle times also gradually increase, and the two become linear relationship, the linear equation is: \[\ y=0.00169-4.2215x, \tag{1}\]
| Grain level | Crystal grain string length / \(\mu m\) | Total should change \(4\Delta \varepsilon _a \)/2/% | Frequency HZ | Circulating weeks \(Nf\) |
| Level 2 | 162 | 0.65 | 0.1679 | 4314 |
| Level 3 | 113 | 0.65 | 0.1679 | 4201 |
| Level 4 | 77 | 0.65 | 0.1679 | 4459 |
| Level 5 | 56 | 0.65 | 0.1679 | 4634 |
| Level 6 | 38 | 0.65 | 0.1679 | 5835 |
| Level 7 | 26 | 0.65 | 0.1679 | 6808 |
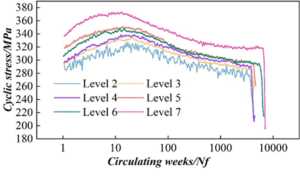
When S32750 duplex stainless steel in the strain amplitude of 0.5%, the strain rate of 0.3% / s, the cyclic stress response of different grain size statistics, Figure 8 for the different grain size corresponding to the cyclic stress response curve. From the figure, it can be seen that the stress cycling response of S32750 duplex stainless steel shows three stages: the cyclic stress rises rapidly, reflecting the obvious phenomenon of rapid cyclic hardening, and it is also observed that the maximum cyclic stress rises gradually with the gradual increase in the grain size level of the material. In the second stage, after the cyclic stress reaches the peak value, the maximum cyclic stress decreases with the increase of the number of cycles, which is reflected as cyclic softening. The third stage is the cyclic softening after entering the cyclic stability until the material is completely destroyed, the higher the grain size level, the more obvious the cyclic stability stage. In addition, as the material grain size level increases, the cycle times of the material also increase accordingly, again proving that the grain refinement can extend the fatigue life of S32750 duplex stainless steel.
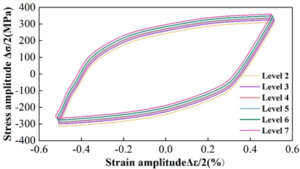
S32750 duplex stainless steel is selected as the test material with different grain size, and Figure 9 shows the stress-strain hysteresis curve at half-life fatigue cycle. It can be seen from the figure, with the increase of grain size level, that is, the gradual decrease of grain size, S32750 duplex stainless steel half-life fatigue cycle maximum cyclic tensile and compressive stresses also increased slightly, the hysteresis curve area also increased slightly.
When studying the cyclic stress response curve corresponding to different grain size test material, it is found that the cyclic stress response shows three stages: rapid cyclic hardening stage, cyclic softening stage, cyclic saturation until the material destruction stage, and the smaller the grain size, the more obvious cyclic saturation stage. With the increase in grain size level that is the gradual refinement of grain size, S32750 duplex stainless steel half-life fatigue cycle when the maximum cyclic tensile and compressive stresses also increased slightly, the hysteresis curve area also increased slightly.
S32750 duplex stainless steel with the increase in grain size level that the grain size is gradually refined, the cycle time is also gradually increased, the two into a linear relationship.
RICE proposes a plastic superposition method based on plasticity analysis, which gives the stress-strain field describing the small-scale yielding of the crack tip under cyclic loading. Since the plastic strain amplitude is much larger than the elastic strain amplitude within the cyclic plastic region of the crack tip, the elastic strain amplitude is neglected, so the stress-strain within the cyclic plastic region of the crack tip can be expressed as: \[ \left\{\begin{array}{c} {\Delta \varepsilon _{p} =2\frac{\sigma _{y} }{E} \left[\frac{\Delta K^{2} }{4\left(1+n_{c} \right)\pi \sigma _{y}^{2} r} \right]^{1/(1+n_{c} )} } \\ {\Delta \sigma =2K_{c} \left(\frac{\Delta \varepsilon _{p} }{2} \right)^{n_{c} } } \end{array}\right. \tag{2}\]
where \(n_{c}\) is the cyclic strain hardening index, \(\sigma _{y}\) is the cyclic yield strength, \(r\) is the distance to the crack tip, and \(K_{c}\) is the cyclic strain strength factor.
According to the small-scale yield stress-strain field at the crack tip under cyclic loading given by RICE, combined with the cyclic stress-strain behaviour of S32750 duplex stainless steel and the amplitude of the stress intensity factor (\(\Delta\)K) with crack extension, the theoretical value of the strain range at the crack tip can be calculated, and the strain range is shown in Table 4. From the table, it can be seen that the strain range within the cyclic plastic zone of the crack tip is the same when the ratio of the crack tip point distance \(r\) to the cyclic plastic zone size \(r_{c}\) is the same. Meanwhile, according to equation (1), it can be seen that the strain range in the plastic zone of the crack tip is mainly affected by the stress intensity factor amplitude (\(\Delta\)K) and is related to the cyclic load and crack length.
| \(\Delta \varepsilon \) \(r/r_c \) | a/mm | |||||
| 10 | 11 | 12 | 13 | 14 | 15 | |
| 0.1 | 1.56 | 0.1 | 1.56 | 0.1 | 1.56 | 0.1 |
| 0.2 | 0.96 | 0.2 | 0.96 | 0.2 | 0.96 | 0.2 |
| 0.4 | 0.58 | 0.4 | 0.58 | 0.4 | 0.58 | 0.4 |
| 0.6 | 0.42 | 0.6 | 0.42 | 0.6 | 0.42 | 0.6 |
| 0.8 | 0.35 | 0.6 | 0.35 | 0.6 | 0.35 | 0.6 |
| 1.0 | 0.29 | 1.0 | 0.29 | 1.0 | 0.29 | 1.0 |
| 1.2 | 0.26 | 1.2 | 0.26 | 1.2 | 0.26 | 1.2 |
| 1.8 | 0.18 | 1.8 | 0.18 | 1.8 | 0.18 | 1.8 |
| 2.4 | 0.16 | 2.4 | 0.16 | 2.4 | 0.16 | 2.4 |
| 2.68 | 0.14 | 2.68 | 0.14 | 2.68 | 0.14 | 2.68 |
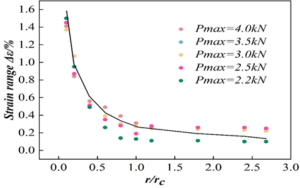
By comparing the theoretical values of strain range in Table 4, it can be seen that when the ratio of distance \(r\) from the crack tip to the cyclic plastic zone size \(r_{c}\) is the same, the strain range based on DIC analysis is basically the same as the theoretical value, however, the DIC results will change with the load and crack length. In order to further analyse the strain range at the fatigue crack tip of S32750 duplex stainless steel, the theoretical values are compared with the test values obtained by DIC, and the variation of the strain range in the plastic zone at the crack tip with the crack tip distance is shown in Figure 10. From the figure, it can be seen that the strain range in the plastic zone of the crack tip obtained based on the theoretical formula and DIC analysis has the same trend of change, the maximum strain range in the plastic zone of the crack tip is at the crack tip, and the strain range decreases as it moves away from the crack tip. When the ratio of the distance from the crack tip \(r\) to the size of the cyclic plastic zone \(r_{c}\) is 0\(\mathrm{\sim}\)1, the region is the cyclic plastic zone of the crack tip, and in the cyclic plastic zone, the minimum strain amplitude is at the boundary of the cyclic plastic zone, and the strain range increases rapidly with the proximity to the crack tip. When the ratio of the distance \(r\) from the crack tip to the size \(r_{c}\) of the cyclic plastic zone is 1\(\mathrm{\sim}\)2.66, the region is the monotonic plastic zone, and the variation of the strain range in the region is small, the maximum strain range is at the boundary of the cyclic plastic zone, and it decreases slowly and tends to a finite value along the direction of the crack extension, and the plastic strain is zero on the boundary of the monotonic plastic zone, and at this time the strain range is equal to the elastic strain range, so the finite value is the crack The minimum elastic strain range in the tip plastic zone.
In addition, the strain ranges within the plastic zone at the crack tip obtained based on the DIC analysis compared with the theoretical values are smaller than the theoretical values when the \(r/r_{c}\) ratio is 0.1, and the smaller the load, the shorter the crack length, and the larger the deviation. As the \(r/r_{c}\) ratio increases, the deviation of the test values from the theoretical values decreases and the test values are distributed on both sides of the theoretical values. Therefore, the strain range in the plastic zone at the crack tip obtained based on DIC analysis has good accuracy, and it can give the strain range and change rule in the plastic zone at the crack tip during the crack extension process.
The stress range at the crack tip can be calculated based on the small yield stress-strain field at the crack tip under cyclic loading given by RICE, i.e., equation (1). Based on the cyclic strain range at the crack tip obtained by DIC, the calculated stress range is shown in Table 5. From the table, it can be seen that the maximum stress range within the plastic zone of the crack tip is concentrated at the crack tip, and the stress range gradually decreases as it moves away from the crack tip. When the ratio of the distance \(r\) from the crack tip to the cyclic plastic zone size \(r_{c}\) is the same, the difference in the distribution range of stress range within the plastic zone of the crack tip is small for different cyclic loads and fatigue crack lengths.
| \(r/r_c \) | Pmax =2.2kN | a/mm | |||||
| 10 | 11 | 12 | 13 | 14 | 15 | ||
| 0.1 | 689 | 690 | 697 | 712 | 756 | 791 | |
| 0.2 | 602 | 625 | 657 | 669 | 664 | 677 | |
| 0.4 | 596 | 609 | 601 | 602 | 646 | 611 | |
| 0.6 | 573 | 583 | 580 | 594 | 611 | 583 | |
| 0.8 | 535 | 547 | 556 | 567 | 579 | 549 | |
| 1.0 | 504 | 507 | 537 | 550 | 540 | 508 | |
| 1.2 | 175 | 185 | 190 | 197 | 162 | 177 | |
| 1.8 | 172 | 183 | 173 | 192 | 158 | 174 | |
| 2.4 | 160 | 179 | 172 | 185 | 158 | 165 | |
| 2.68 | 165 | 172 | 178 | 185 | 155 | 162 | |
| 0.1 | Pmax =2.5kN | 721 | 713 | 748 | 747 | 772 | 787 |
| 0.2 | 707 | 700 | 683 | 715 | 693 | 737 | |
| 0.4 | 615 | 589 | 613 | 624 | 565 | 593 | |
| 0.6 | 597 | 583 | 579 | 562 | 566 | 547 | |
| 0.8 | 577 | 554 | 560 | 534 | 520 | 509 | |
| 1.0 | 501 | 486 | 537 | 507 | 477 | 495 | |
| 1.2 | 175 | 166 | 193 | 183 | 156 | 164 | |
| 1.8 | 174 | 162 | 183 | 184 | 147 | 167 | |
| 2.4 | 165 | 155 | 181 | 177 | 139 | 166 | |
| 2.68 | 163 | 158 | 181 | 182 | 136 | 162 | |
| 0.1 | Pmax =3.0kN | 691 | 698 | 712 | 742 | 765 | 779 |
| 0.2 | 664 | 670 | 676 | 705 | 705 | 700 | |
| 0.4 | 562 | 614 | 619 | 619 | 575 | 583 | |
| 0.6 | 542 | 582 | 591 | 557 | 535 | 531 | |
| 0.8 | 527 | 572 | 559 | 529 | 514 | 506 | |
| 1.0 | 520 | 545 | 526 | 500 | 463 | 479 | |
| 1.2 | 181 | 206 | 141 | 173 | 95 | 88 | |
| 1.8 | 181 | 202 | 164 | 178 | 94 | 82 | |
| 2.4 | 181 | 198 | 139 | 174 | 87 | 80 | |
| 2.68 | 180 | 185 | 140 | 175 | 88 | 74 | |
| 0.1 | Pmax =3.5kN | 707 | 709 | 715 | 765 | 784 | 796 |
| 0.2 | 706 | 684 | 705 | 692 | 708 | 704 | |
| 0.4 | 636 | 606 | 574 | 590 | 602 | 589 | |
| 0.6 | 608 | 575 | 548 | 550 | 546 | 536 | |
| 0.8 | 587 | 541 | 525 | 511 | 502 | 492 | |
| 1.0 | 569 | 513 | 498 | 502 | 429 | 509 | |
| 1.2 | 218 | 175 | 95 | 99 | 124 | 182 | |
| 1.8 | 209 | 177 | 98 | 97 | 121 | 175 | |
| 2.4 | 208 | 170 | 82 | 105 | 120 | 172 | |
| 2.68 | 204 | 169 | 88 | 103 | 120 | 174 | |
| 0.1 | Pmax =4.0kN | 696 | 713 | 769 | 786 | 790 | 802 |
| 0.2 | 679 | 708 | 708 | 710 | 699 | 721 | |
| 0.4 | 654 | 641 | 616 | 617 | 589 | 585 | |
| 0.6 | 629 | 616 | 564 | 567 | 517 | 488 | |
| 0.8 | 608 | 595 | 527 | 532 | 473 | 416 | |
| 1.0 | 579 | 566 | 502 | 509 | 431 | 407 | |
| 1.2 | 227 | 216 | 171 | 178 | 117 | 97 | |
| 1.8 | 223 | 213 | 173 | 172 | 111 | 87 | |
| 2.4 | 219 | 195 | 163 | 164 | 109 | 92 | |
| 2.68 | 217 | 189 | 165 | 165 | 103 | 87 | |
In summary, the stress-strain curve in the plastic zone of the fatigue crack tip of duplex stainless steel is obtained, and the stress-strain curve in the plastic zone of the fatigue crack tip of stainless steel is shown in Figure 11. The cyclic stress-plastic strain curve at the crack tip in the figure can be found in the monotonic plasticity zone, the crack tip stress amplitude is small, the corresponding plastic strain amplitude is small. In the cyclic plasticity zone, the stress amplitude gradually increases with the proximity to the crack tip, and the plastic strain amplitude gradually increases and becomes equal to the total strain amplitude. The gap formed between the cyclic stress-strain curve at the crack tip and the cyclic stress-plastic strain curve in the figure represents the elastic strain in the plastic zone at the crack tip, and it can be found that the elastic strain amplitude gradually increases with the proximity to the crack tip, and the elastic strain amplitude is larger than the plastic strain amplitude within the monotonous plastic zone, and the elastic strain amplitude is higher than the plastic strain amplitude when the total strain amplitude is 0.14%, i.e., the elastic strain amplitude is higher than the plastic strain amplitude in the boundary of the cyclic plastic zone and the monotonous plastic zone, and the plastic strain amplitude is lower than the elastic strain amplitude. Plastic strain amplitude, after which the plastic strain amplitude increases rapidly and dominates.

With the increase of solid solution temperature, the yield and tensile strength of the test steel increased by 39 MPa and 31.3 MPa, respectively. Under the same loading conditions, the number of fatigue cycles of the test steel was increased from 9,158 to 17,288, and the fatigue life was extended by more than 87%.
The cyclic stress response shows a rapid cyclic hardening stage, cyclic softening stage, cyclic saturation until the material destruction stage, and the smaller the grain size, the more obvious three stages of cyclic saturation stage. Duplex stainless steel with the increase in grain size level that is, the grain size is gradually refined, the cycle time is also gradually increased, and the two become linear relationships.
In different peak load conditions, the whole fatigue crack extension process crack tip equivalent strain with the fatigue crack length, the number of cycles of the trend is basically the same. In the stable crack expansion stage, the equivalent strain at the crack tip increases slowly, and with the rapid expansion stage, the equivalent strain at the crack tip region increases rapidly.
Khoshmanesh, K., Tang, S. Y., Zhu, J. Y., Schaefer, S., Mitchell, A., Kalantar-Zadeh, K., & Dickey, M. D. (2017). Liquid metal enabled microfluidics. Lab on a Chip, 17(6), 974-993.
Zouaghi, S., Six, T., Bellayer, S., Moradi, S., Hatzikiriakos, S. G., Dargent, T., … & Jimenez, M. (2017). Antifouling biomimetic liquid-infused stainless steel: application to dairy industrial processing. ACS applied materials & interfaces, 9(31), 26565-26573.
Yang, H., Olia, H., & Thomas, B. G. (2021). Modeling air aspiration in steel continuous casting slide-gate nozzles. Metals, 11(1), 116.
Kelley, D. H., & Weier, T. (2018). Fluid mechanics of liquid metal batteries. Applied Mechanics Reviews, 70(2), 020801.
University of Michigan. Continuing Engineering Education. (1978). Continuous Casting of Steel. University of Michigan, College of Engineering.
Hu, H., Mao, L., Yin, S., Liao, H., & Zhang, C. (2022). Wear-resistant ceramic coatings deposited by liquid thermal spraying. Ceramics International, 48(22), 33245-33255.
Yuan, Z., Chen, B., & Zhao, J. (2011). Effect of manipulated variables selection on the controllability of chemical processes. Industrial & Engineering Chemistry Research, 50(12), 7403-7413.
Vachaparambil, K. J., & Einarsrud, K. E. (2019). Comparison of surface tension models for the volume of fluid method. Processes, 7(8), 542.
Krishnan, K. S. G., Bertram, O., & Seibel, O. (2017). Review of hybrid laminar flow control systems. Progress in Aerospace Sciences, 93, 24-52.
Chen, H., Gu, D., Dai, D., Ma, C., & Xia, M. (2017). Microstructure and composition homogeneity, tensile property, and underlying thermal physical mechanism of selective laser melting tool steel parts. Materials Science and Engineering: A, 682, 279-289.
Chen, C., Huang, Z., Jiao, Y., Shi, L. A., Zhang, Y., Li, J., … & Jiang, L. (2019). In situ reversible control between sliding and pinning for diverse liquids under ultra-low voltage. Acs Nano, 13(5), 5742-5752.
Lin, Y., Genzer, J., & Dickey, M. D. (2020). Attributes, fabrication, and applications of gallium-based liquid metal particles. Advanced Science, 7(12), 2000192.
Amy, C., Budenstein, D., Bagepalli, M., England, D., DeAngelis, F., Wilk, G., … & Henry, A. (2017). Pumping liquid metal at high temperatures up to 1,673 kelvin. Nature, 550(7675), 199-203.
Li, F., Shu, J., Zhang, L., Yang, N., Xie, J., Li, X., … & Sun, D. (2020). Liquid metal droplet robot. Applied Materials Today, 19, 100597.
Shone, A., Koyn, Z., Kamiyama, B., Perez, E., Barrus, L., Bartlett, N., … & Andruczyk, D. (2022). HIDRA-MAT liquid metal droplet injector for liquid metal applications in HIDRA. Fusion Engineering and Design, 180, 113193.
Liu, J., Sheng, L., & He, Z. Z. (2018). Liquid metal soft machines: principles and applications. Springer.
Zhang, T., Yang, J., & Jiang, P. (2019). Measurement of molten steel velocity near the surface and modeling for transient fluid flow in the continuous casting mold. Metals, 9(1), 36.
Wang, D., Wang, X., & Rao, W. (2021). Precise regulation of Ga-based liquid metal oxidation. Accounts of Materials Research, 2(11), 1093-1103.
Abbas, S. Z., Khan, M. I., Kadry, S., Khan, W. A., Israr-Ur-Rehman, M., & Waqas, M. (2020). Fully developed entropy optimized second order velocity slip MHD nanofluid flow with activation energy. Computer Methods and Programs in Biomedicine, 190, 105362.
Thomas, B. G. (2018). Review on modeling and simulation of continuous casting. steel research international, 89(1), 1700312.
Zhang, H., & Wang, W. (2016). Mold simulator study of the initial solidification of molten steel in continuous casting mold: Part II. Effects of mold oscillation and mold level fluctuation. Metallurgical and Materials Transactions B, 47, 920-931.
Fu, H., Nagasaka, T., Kometani, N., Muroga, T., Guan, W., Nogami, S., … & Tanigawa, H. (2015). Effect of post-weld heat treatment and neutron irradiation on a dissimilar-metal joint between F82H steel and 316L stainless steel. Fusion Engineering and Design, 98, 1968-1972.
Kozaderov, O., Światowska, J., Dragoe, D., Burliaev, D., & Volovitch, P. (2021). Effect of Cr (III) passivation layer on surface modifications of zinc-nickel coatings in chloride solutions. Journal of Solid State Electrochemistry, 25, 1161-1173.