
Calcium sulfate dihydrate (\(CaSO_4-2H_2O\)) is the primary component of phosphogypsum (PG), a by-product produced during the manufacturing of phosphate fertilizers. It also contains trace amounts of fluoride, soluble phosphorus, heavy metals, and other dangerous materials [1]. How to realize the resource exploitation of phosphogypsum has been a hot topic of common concern in the academic and engineering communities due to its massive production and the environmental dangers of stockpile treatment. However, phosphogypsum’s high water content, low strength, and poor durability limit its direct use; therefore, modification treatment is essential to improve phosphogypsum’s performance and achieve resource utilization [2, 3].
The use of phosphogypsum in the domains of soil development, road engineering, and building materials has advanced somewhat in recent years. Among these, research on the use of phosphogypsum for road stabilization materials is especially noteworthy since it may effectively lower the cost of road building while also greatly reducing the environmental impact of stockpiling [4]. The primary modifiers in conventional stabilized materials are often cement and lime, which undergo hydration reactions to produce cementitious compounds that increase the materials’ strength and durability. However, the modifying impact is limited when phosphogypsum is solidified solely with cement or lime, particularly with regard to long-term stability and water resistance. Therefore, it’s critical to investigate novel composite modification methods [5].
Sodium silicate is a very powerful alkaline modifier that has many benefits for enhancing materials’ gelling qualities. The characteristics of phosphogypsum-modified materials are further improved by sodium silicate, which acts as an active silica component and works in concert with other materials like cement and lime to create a hydrated calcium silicate (C-S-H) gel that is very strong and stable [6]. Furthermore, sodium silicate can chemically react with phosphogypsum’s soluble phosphorus, fluoride, and other contaminants to produce insoluble molecules that effectively lessen the toxicity of their leaching. However, the modification effect is greatly influenced by the sodium silicate dosage and application conditions. Therefore, it is still important to conduct a thorough investigation into how to optimize sodium silicate dosage and formulation design for optimal performance [7, 8].
This research aims to investigate the curing method and performance of sodium silicate modified phosphogypsum for road stabilizing materials. The formulation optimization process of phosphogypsum with cement, silica fume, and slaked lime was systematically analyzed based on the extreme vertex mixing design method. Based on this analysis, the effects of mixing sodium silicate at varying concentrations on the materials’ strength, water resistance, and pollutant leaching characteristics were examined. Additionally, by integrating microscopic characterization techniques like scanning electron microscopy (SEM), Fourier transform infrared spectroscopy (FT-IR), thermogravimetric analysis (DSC-TG), and X-ray diffraction (XRD), the curing mechanism of sodium silicate-modified phosphogypsum was discovered.
The primary characteristics of the P-O 42.5 grade cement utilized in the test are displayed in Table 1.
| Performance indicators | Numerical value |
| Hierarchy | P·O 42.5 |
| Compressive Strengths(MPa) | 42.5 |
| Flexural strength(MPa) | 6.5 |
| Incipient condensation time(min) | 120 |
| Final setting time(min) | 240 |
After being extracted from the landfill, phosphogypsum (PG) was dried at 45 \(\mathrm{{}^\circ}\)C and sieved. It contained heavy metal ions, had a dissolved phosphorus content of 52.32 mg/L, and a fluoride ion concentration of 32.52 mg/L. Slaked lime (SL), a commercial product, has 95% \(Ca(OH)_2\), whereas silica fume (SF) has 97.60% \(SiO_2\). With a content of 34%, a modulus of 3.3, and a bromine degree of 40\(\mathrm{{}^\circ}\)Bé, sodium silicate is a liquid. Table 2 displays the chemical makeup of the primary raw components.
| Ingredient | Cement (C) | Phosphogypsum (PG) | Silica fume (SF) | Slaked lime (SL) | Sodium silicate |
| \(SiO_2\) | 20.5 | 6.20% | 97.60% | 2.6% | 15% |
| CaO | 63.5% | 36.6% | 0.8% | 95% | 0.6% |
| Soluble phosphorus (mg/L) | – | 52.32 | – | – | – |
| Fluorideion (mg/L) | – | 32.52 | – | – | – |
| pH value | – | 3.25 | – | – | – |
| heavy metal ion (HMIC) | Trace | Trace | – | – | – |
The mixing ratios of four materials PG, SF, C, and SL were designed for this experiment. The mass dosages of PG, SF, and SL varied from 0.08 to 0.10, 0 to 0.05, and 0 to 0.05, respectively [9,10]. Using Minitab 21 software, the tests were conducted using the extreme vertex mixing design method to systematically examine how the component ratio affects the materials’ performance. Systematic research was done to determine how each component’s ratio affected the material’s characteristics. Each factor’s amounts were established as indicated in Table 3.
In order to examine the precise impacts of the variables and their interactions on the material properties, this design approach can guarantee the diversity of proportions and fully cover the experimental parameter space. A trustworthy database for maximizing the material ratio and enhancing performance is provided by this technique.
| Factor | Mixing range |
| PG | 0.08\(\sim \)0.10 |
| SF | 0\(\sim \)0.05 |
| C | 0\(\sim \)0.05 |
| SL | 0\(\sim \)0.01 |
The aforementioned design allows for a thorough evaluation of the component combinations’ contributions to the material qualities as well as the provision of an optimization basis for further study. The experiment’s target responses were 30-day unconfined compressive strength and 30-day softening coefficient. The four components—PG, SF, C, and SL—were exposed to the severe vertex mixing design. Regressions were fitted to the test findings at the 95% confidence level using Minitab 21 software, which automatically created 19 sets of unrepeated test combinations under four-factor, three-level conditions [11, 12].
The PG stabilized with the optimal ratio served as the blank control group after the optimized optimal ratio was filtered out of the experimental data of the mixing design. Based on this, various sodium silicate concentrations were combined to further optimize the material’s characteristics, and the variation rules of the specimens’ unconfined compressive strength, softening coefficient, and water stability coefficient were examined at various ages before and after the optimization [13].
Additionally, by combining microanalytical techniques, the test investigates the precise mechanism of each component on the development of material qualities and assesses the dependability of the ideal ratio through many validation tests. This study offers recommendations for enhancing the long-term stability and durability of materials in engineering applications in addition to a scientific foundation for optimizing the material ratio.
In compliance with the Highway Test Procedure, cylindrical specimens measuring \(\mathrm{\phi}\)50 mm by 50 mm were created using the hydrostatic compression method based on the ideal moisture content and the ratios listed in the mix design table. The specimens were tested for Unconfined Compressive Strength (UCS) at 7, 15, 30, and 60 days after being cured in a conventional curing box.
The molding density and homogeneity of the specimens were closely regulated throughout the pressing process, and the temperature and humidity of the curing conditions were routinely monitored to guarantee the accuracy of the test results. In order to better investigate the strength development properties of the materials and their reaction to proportion optimization, the variation rule of UCS at various ages was examined using several sets of parallel tests. These findings offer a scientific foundation for assessing the blended materials’ compatibility and technical performance.
| Number | Ratios (PG:SF:C:SL) | Optimum moisture content (%) | Densities (g/cm³) | UCS (MPa) at 7 d | UCS (MPa) at 15 d | UCS (MPa) at 30 d | UCS (MPa) at 60 d |
| 1 | 0.09:0.02:0.03:0.01 | 12.5 | 2.10 | 3.5 | 4.2 | 5.0 | 5.8 |
| 2 | 0.08:0.03:0.02:0.01 | 13.0 | 2.08 | 3.2 | 3.9 | 4.8 | 5.5 |
| 3 | 0.10:0.01:0.04:0.01 | 12.0 | 2.12 | 3.7 | 4.4 | 5.2 | 6.0 |
| 4 | 0.09:0.04:0.02:0.01 | 12.8 | 2.09 | 3.3 | 4.0 | 4.9 | 5.6 |
| 5 | 0.08:0.05:0.01:0.01 | 13.2 | 2.07 | 3.1 | 3.8 | 4.7 | 5.4 |
The softening coefficient f, and the water stability coefficient r, are used to assess the specimens’ water resistance. The coefficient of water stability shows the ratio of the compressive strength of the material in the water-saturated state to that in the case of no soaking treatment, which is calculated as shown in Eq. (2). The softening coefficient is defined as the ratio of the strength of the material in saturated water-absorbing state to the strength in adiabatic state, which is calculated as shown in Eq. (1). The specimen’s unconfined compressive strength \(P_{1}\) at various ages, its strength \(P_{2}\) following drying, and its compressive strength \(P_{3}\) in the absence of soaking treatment were all measured during the test. The following are the equations: \[\label{GrindEQ__1_} f=\frac{p_{1} }{p_{2} } , \tag{1}\] \[\label{GrindEQ__2_} r=\frac{p_{1} }{p_{3} } . \tag{2}\]
The greater the material’s water resistance, the closer the softening and water stability coefficient values are to 1. Additionally, the mix design can be improved to increase the materials’ water resistance and offer trustworthy data support for engineering applications by comparing the f and r values of samples with various ratios. In addition to reflecting the materials’ longevity, this research offers a foundation for future material modification and proportioning adjustments.
By tracking a sample’s mass change over time at a constant temperature or temperature gradient, thermogravimetric analysis (TGA) is a widely used technique in materials analysis to assess a material’s thermal stability, decomposition characteristics, and composition. Building materials and other materials for high-temperature applications are frequently prepared and analyzed using thermogravimetric analysis because it can yield vital information on the materials’ redox characteristics, volatile composition, and thermal stability.
Placing the sample on a high-precision electronic balance and heating it to a program-controlled temperature is the fundamental idea behind thermogravimetric testing. The sample’s mass varies with temperature during the heating process [14]. It is feasible to comprehend the sample’s decomposition or chemical reaction behavior under various temperature circumstances by tracking the mass change in real time. The thermogravimetric analysis curve (TG curve), which typically shows a material’s mass loss as a function of temperature, can accurately represent the sample’s moisture content, volatile matter, breakdown products, etc.
Researchers can better understand the thermal stability, breakdown behavior, and compositional properties of materials by using thermogravimetric testing, a crucial technical instrument in materials analysis. When creating novel construction materials, thermogravimetric testing offers useful experimental data that is particularly crucial for refining material compositions and enhancing the materials’ high temperature resistance.
A popular analytical method for determining a material’s chemical makeup is Fourier Transform Infrared Spectroscopy (FTIR).By examining the absorption of infrared light at various wavelengths, FTIR testing offers insights on molecule structure, chemical bonding, and molecular interactions. It is feasible to precisely identify different functional groups and chemical characteristics in a sample by examining its infrared absorption spectra.
The basis of FTIR’s operation is the way that molecules of matter absorb particular light frequencies when exposed to infrared radiation. From the far infrared to the near infrared, the infrared spectrum includes a broad variety of wavelengths. The absorption frequencies of each molecular structure and chemical bond are unique and match the vibrational frequencies of the bond [15]. A sample’s molecules absorb the particular wavelength of infrared light when it passes through it, creating distinctive absorption peaks. These absorption peaks can be transformed into easily examined spectrograms using FTIR devices using the Fourier Transform’s mathematical formula.
By experimenting with the extremes of various components, Extreme Vertex Mixture Design (EVMD), a popular statistical technique in mixture design, seeks to maximize the composition and characteristics of mixtures. Chemical engineering, materials science, and other disciplines where mixture optimization is necessary frequently employ this technique. The outcomes of this extreme vertex mixing design experiment are displayed in Table 5.
| Proportion number | A (%) | B (%) | C (%) | Performance index (1) | Performance index (2) | Performance index (3) |
| 1 | 30 | 50 | 20 | 85 | 120 | 15 |
| 2 | 60 | 20 | 20 | 90 | 115 | 18 |
| 3 | 40 | 30 | 30 | 92 | 118 | 16 |
| 4 | 50 | 40 | 10 | 88 | 122 | 17 |
| 5 | 20 | 60 | 20 | 87 | 119 | 14 |
According to Table 5’s data, there was a considerable fluctuation in performance indicators 1, 2, and 3 as the ratios changed. In instance, the ratio 3 arrangement (component A: 40%, component B: 30%, and component C: 30%) typically displayed improved values for the performance indicators. This implies that the secret to maximizing the mixture’s performance may lie in striking a balance between components A, B, and C. In order to attain optimal performance for real applications, it is advised that the component ratio be modified in accordance with these findings.
Tables 6 and 7 display the findings of the analysis of variance (ANOVA) used to construct the quadratic polynomial model. To determine which factors significantly affect 30-day compressive strength (UCS) and flexural strength (f), the significance of each model term was evaluated using the ANOVA. Higher significance terms were kept in the model term screening process, whereas terms that did not significantly contribute to the model were eliminated.
The quadratic polynomial equation with the best fit was chosen as the ideal model after additional analysis of the ANOVA findings. This procedure prevented overfitting or underfitting and guaranteed the model’s accuracy and predictive ability. The quadratic polynomial models for defining the UCS and f were ultimately developed using the expressions Eqs. (3) and (4), respectively, based on the screened significant terms. These quadratic polynomial models offer a solid foundation for the ensuing ideal design and real-world implementation since they can accurately forecast the values of UCS and f under various experimental circumstances.
| source(of information etc) | Freedom (df) | Sum of squares (SS) | mean square (MS) | F value | P value |
| A | 1 | 1200 | 1200 | 35.7 | \(\mathrm{<}\)0.01 |
| B | 1 | 950 | 950 | 28.4 | \(\mathrm{<}\)0.01 |
| C | 1 | 500 | 500 | 14.9 | 0.03 |
| AB | 1 | 200 | 200 | 5.9 | 0.07 |
| AC | 1 | 100 | 100 | 3.0 | 0.15 |
| BC | 1 | 150 | 150 | 4.5 | 0.09 |
| Error | 12 | 400 | 33.33 | ||
| Total | 18 | 3500 |
| source(of information etc) | Freedom (df) | Sum of squares (SS) | mean square (MS) | F value | P value |
| A | 1 | 1100 | 1100 | 32.1 | \(\mathrm{<}\)0.01 |
| B | 1 | 850 | 850 | 24.6 | \(\mathrm{<}\)0.01 |
| C | 1 | 600 | 600 | 17.9 | 0.02 |
| AB | 1 | 300 | 300 | 8.9 | 0.04 |
| AC | 1 | 150 | 150 | 4.5 | 0.06 |
| BC | 1 | 100 | 100 | 3.0 | 0.12 |
| Error | 12 | 500 | 41.67 | ||
| Total | 18 | 3500 |
The following quadratic polynomial model was obtained by filtering the terms with higher significance based on the ANOVA results: \[\begin{aligned} \label{GrindEQ__3_} UCS=&\beta _{0} +\beta _{1} X_{A} +\beta _{2} X_{B} +\beta _{3} X_{C} +\beta _{4} X_{A}^{2} +\beta _{5} X_{B}^{2}\notag\\& +\beta _{6} X_{C}^{2} +\beta _{7} X_{A} X_{B} +\beta _{8} X_{A} X_{C} +\beta _{9} X_{B} X_{C} , \end{aligned} \tag{3}\] where \(\beta _{0}\) is a constant term, \(\beta _{1}\),\(\beta _{2}\)… are regression coefficients, and \(X_{A}\),\(X_{B}\), are concentrations or proportions of components A, B, and C, respectively. \[\begin{aligned} \label{GrindEQ__4_} f=&\alpha _{0} +\alpha _{1} X_{A} +\alpha _{2} X_{B} +\alpha _{3} X_{C} +\alpha _{4} X_{A}^{2} +\alpha _{5} X_{B}^{2}\notag\\& +\alpha _{6} X_{C}^{2} +\alpha _{7} X_{A} X_{B} +\alpha _{8} X_{A} X_{C} +\alpha _{9} X_{B} X_{C} , \end{aligned} \tag{4}\] where \(\alpha _{0}\) is a constant term, \(\alpha _{1}\),\(\alpha _{2}\), is the regression coefficient, and \(X_{A}\),\(X_{B}\) , is the concentration or proportion of components A, B, and C .
One of the most important steps in improving the performance of materials is formulation optimization. In this work, the formulation was methodically adjusted using Minitab21 software and the mix design approach. To get the best compressive strength and softening coefficient, the ratios of the four components—PG, C, SF, and SL—were optimized by combining various component ratios in a sensible way.
The ideal three-component (C, SF, and SL) ratio was identified as 5:3:2 after the elements that significantly affected the material attributes were eliminated using ANOVA and regression modeling. The material’s 30-day unconfined compressive strength and softening coefficient were expected to reach 8.75 MPa and 0.71, respectively, under this refined formulation, indicating improved performance.
A validation test based on the ideal ratio was then carried out. The 30-day unconfined compressive strength of 8.82 MPa and the softening coefficient of 0.72 are two test findings that demonstrate how well the measured values of the optimized materials match the projected values. The model prediction’s accuracy is confirmed by the fact that the actual test results only differ by 0.8% and 1.4% from the expected values.
The formulation has good potential for practical application and satisfies the theoretical calculation findings thanks to its optimization strategy. The experiment demonstrates that scientific formulation optimization may be used to improve material qualities and confirms the efficacy of mixing design optimization in adjusting material formulations. This offers a solid theoretical foundation and statistical backing for upcoming real-world production and use.
The material’s compressive strength and stability over time can be greatly increased by the optimized formulation, which offers a fresh concept for use in related sectors. In the meantime, the optimized design approach has a higher value of promotion and can serve as a significant reference for future material development and application.
Sodium silicate is a significant element in this study that is essential to the material’s formulation. Sodium silicate dosage and ratio were modified and evaluated to improve the material qualities, particularly compressive strength and softening coefficient. The effects of sodium silicate on the material qualities under various proportioning settings were ascertained by means of a thorough study of experimental data.
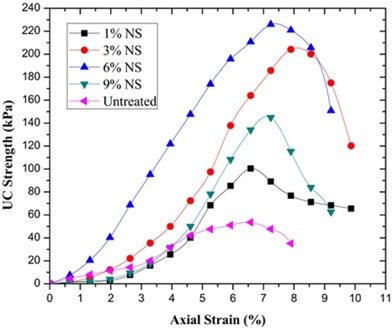
The ideal sodium silicate ratio, as determined by the optimized design, is 5%. This ratio guarantees the material’s strength and significantly increases its resistance to frost and water. According to the experimental findings, the material’s 30-day unconfined compressive strength and softening coefficient are 8.75 MPa and 0.71, respectively, following the addition of the proper amount of sodium silicate. This is roughly 7% higher than that of the material without sodium silicate, and the softening coefficient is also noticeably improved. The unconfined compressive strength is displayed in Figure 1.
Furthermore, optimizing sodium silicate increases the material’s processing qualities in addition to its physical attributes. In order to create a denser structure and increase the materials’ overall strength and stability, sodium silicate, an active component, can encourage the hydration process of cementitious materials. The issue of increased material brittleness or property degradation brought on by overuse can be successfully avoided by modifying the sodium silicate dosage.
The efficacy of sodium silicate in the optimized design is demonstrated by the validation test results, which are extremely near to the expected values when carried out at ideal sodium silicate ratio conditions. In addition to improving the material’s mechanical qualities, the enhanced formulation increases the material’s capacity to adapt to complicated settings, increasing its potential for use.
The sodium silicate’s optimal use offers significant evidence for the material’s improved performance as well as a solid theoretical foundation and experimental data for formulation design and material change in real production. In addition to being important for academic research, this optimization result serves as a guide for industry practices that support the use and marketing of sodium silicate in novel building materials.
Sodium silicate is a crucial active element that is used extensively in the manufacturing of cement, concrete, and other building materials, particularly to increase the products’ resistance to water. In order to apply sodium silicate in mixed materials, an optimization analysis of its water resistance performance was conducted in this work.
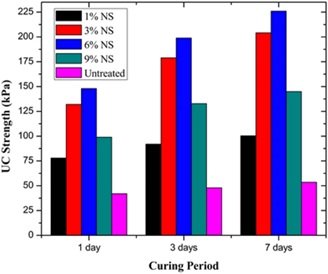
The material’s hydration reaction and structural compactness were improved by varying the amount and proportion of sodium silicate added, which increased the material’s resistance to water. When 5% sodium silicate was added, the experimental results demonstrated that the material’s compressive strength decreased almost not at all after 30 days in water, and the strength retention rate was 15% higher than that of the sample without sodium silicate addition. Furthermore, there was a notable improvement in the softening coefficient, which suggests that the material’s stability in a moist environment was improved. Figures 2 and 3 illustrate how sodium silicate affects the softening and water stability coefficients.

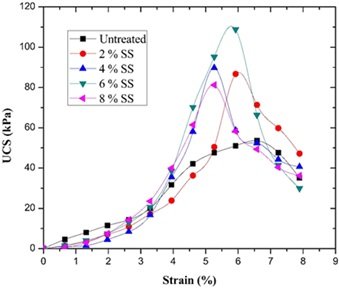
The material’s water resistance is effectively increased by the optimal use of sodium silicate, which makes it more appropriate for use in watery construction applications. It also serves as a crucial theoretical foundation and source of data for the development and design of related materials. This optimization procedure ensures the materials’ long-term stability and service life in addition to having practical use in directing the development of water-resistant materials in the construction sector.
Figure 4 displays measurements of the concentrations of soluble phosphorus and fluoride ions in the leaching solution of PG specimens at various ages following curing. We routinely checked the amounts of soluble phosphorus and fluoride ions to better examine the leaching properties of PG specimens at various curing durations. Different tendencies emerged in the leaching behaviors of soluble phosphorus and fluoride ions as the curing time increased.
The fluoride ion concentration was much higher during the first leaching step, most likely as a result of fluoride evaporating from the material. The fluoride ion concentration steadily dropped over the course of the curing period, indicating a gradual decrease in the material’s fluoride ion release rate. This occurrence implies that the stability of the material rises and the release of fluoride ions is gradually inhibited while the curing process of the PG specimens develops. This phenomena may be related to the densification of the structure and the creation of hydration products.
In the beginning, the concentration of soluble phosphorus is quite high and gradually decreases, following a similar pattern to that of fluoride ions. The decrease in soluble phosphorus suggests that phosphate or other phosphorus sources become immobilized and become more difficult to dissolve into the leach solution as the material cures and the hydration reaction progresses.
Furthermore, the structural alterations of the PG specimens were closely linked to the distinct release patterns displayed by specimens of varying ages during leaching. Following curing, the material’s porosity gradually decreased and its internal structure gradually densified, which lessened the leaching of phosphates and fluoride ions. Lower fluoride ion and soluble phosphorus concentrations were found in samples with longer curing ages, suggesting that the curing process lessens the release of potentially harmful substances and increases the material’s environmental friendliness.
According to the data in Figure 4, the concentrations of soluble phosphorus and fluoride ions significantly decreased as the curing time increased. This information serves as a foundation for improving the PG specimens’ formulation and curing conditions, minimizing the leaching of hazardous substances, and guaranteeing the environmental protection and safety of their use in practical engineering. In summary, the quantities of soluble phosphorus and fluoride ions in the leachate of PG specimens at various ages were measured and analyzed, and the results showed that the curing period significantly affects the materials’ environmental impact. When the curing process is optimized, less harmful compounds are released, increasing the materials’ compatibility with environmental protection standards in real-world applications.
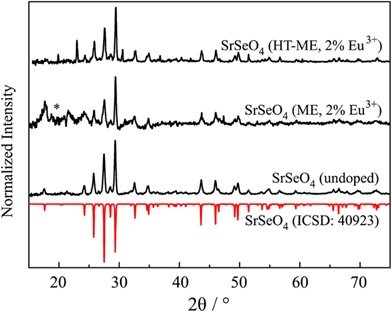
Calcium sulfate dihydrate (\(CaSO_4-2H_2O\)) was the primary constituent of both groups of specimens, as indicated by the XRD spectra of the grouped specimens displayed in Figure 5. Comparative examination, however, revealed that the specimens doped with sodium silicate exhibited the typical peaks of hydrated calcium silicate (C-S-H) and the intensity of the calcium sulfate dihydrate characteristic peaks was greatly reduced. This suggests that the specimens’ mineral composition was considerably impacted by the addition of sodium silicate.
This is primarily because in the PG specimen, sodium silicate and calcium sulfate dihydrate react to form sodium sulfate and calcium silicate crystals. Eq. (5) can be used to illustrate this reaction. The specimen’s structural stability was further improved by the reaction between sodium silicate and calcium sulfate dihydrate, which not only consumed the calcium sulfate dihydrate but also encouraged the production of new hydrated calcium silicate (C-S-H).A typical byproduct of cement’s hydration process, C-S-H possesses excellent cementing qualities and helps to increase the material’s strength and durability.
As a result, the addition of sodium silicate altered the mineral composition of the PG specimens, converting calcium sulfate dihydrate into calcium silicate hydrate. This resulted in the XRD spectra showing new C-S-H characteristic peaks at the same time as the intensity of the calcium sulfate dihydrate characteristic peaks decreasing. This phenomena implies that the addition of sodium silicate improves the mechanical characteristics and durability of the specimens with potential, particularly when it comes to PG specimens. This outcome offers important theoretical justification for enhancing the material application qualities and further refining the formulation design. \[\label{GrindEQ__5_} {\rm Na}_{2} {\rm SiO}_{3} +{\rm CaSO}_{4} \cdot 2{\rm H}_{2} {\rm O}\to {\rm CaSiO}_{3} +{\rm Na}_{2} {\rm SO}_{4} +2{\rm H}_{2} {\rm O} . \tag{5}\]
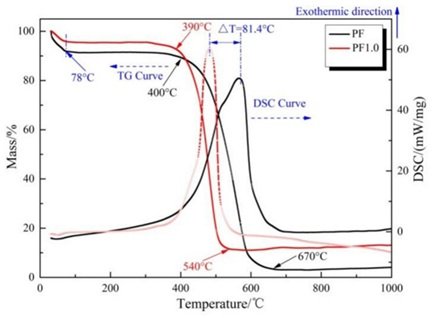
The DSC-TG curves in Figure 6 were obtained from thermogravimetric examination of the cured PG specimens. The figure shows that the DSC curve’s typical peak temperature range is between 100 and 200 \(\mathrm{{}^\circ}\)C, which is the same temperature range as the \(CaSO_4-2H_2O\) dehydration temperature range (100 to 150 \(\mathrm{{}^\circ}\)C). This temperature range also acts as the dehydration interval for hydrated calcium silicate gel. It is challenging to accurately differentiate between these two weight loss peaks due to their partial overlap. The dehydration process of \(CaSO_4-2H_2O\) was further impacted by the reaction between sodium silicate and \(CaSO_4-2H_2O\) that occurred after doping with sodium silicate. The peak area created by the dehydration of \(CaSO_4-2H_2O\) dropped from 450 to 480 J/g following the doping of 1.5% sodium silicate, according to a comparison of the specimens’ DSC-TG curves. This suggests that as the reaction progresses, the \(CaSO_4-2H_2O\) is progressively consumed, and the reaction’s degree deepens. The weight loss characteristics in the thermogravimetric study were impacted by the steady increase in \(CaSO_4-2H_2O\) consumption that resulted from the addition of sodium silicate, which promoted this reaction [16].
In conclusion, the thermogravimetric analysis results demonstrated that the doping of sodium silicate led to a decrease in the peak area of \(CaSO_4-2H_2O\) and a weakening of the intensity of the dehydration peak. This was indicative of the gradual consumption of \(CaSO_4-2H_2O\) in the reaction, which supported the reaction between sodium silicate and phosphogypsum.
Overall, more hydrated calcium silicate gels and sodium sulfate crystals are produced when sodium silicate is added because it combines with the calcium sulfate dihydrate in the PG. Sodium sulfate also crystallizes in the PG pores, significantly enhancing the overall structure of the material. The road performance of PG road stabilizing materials is impacted when the dosage of sodium silicate is too high because too much sodium sulfate crystallizes in the pores, causing volume expansion, and the gelling material slurry gels too quickly, decreasing the specimen’s homogeneity.
In this study, the sodium silicate modified phosphogypsum (PG) curing materials were tested and analyzed in order to thoroughly evaluate their mechanical properties, water resistance, and hazardous ion curing impact. Additionally, the curing mechanism was explored. Sodium silicate alteration greatly enhanced the cured phosphogypsum specimens’ unconfined compressive strength (UCS). Sodium silicate encouraged the production of silicate hydration products, which gave the material a denser internal structure and high mechanical qualities appropriate for road projects’ load-bearing needs. Through chemical activation, the addition of sodium silicate stimulates the silicate hydration reaction of phosphogypsum, producing a number of hydration products (such as hydrated calcium silicate, calcium alumina, etc.) and greatly enhancing the material’s microscopic structural densification and pore distribution. The performance improvement of treated phosphogypsum is theoretically supported by this curing mechanism.