Since composite pressure vessels have obvious advantages in meeting the demand for structural weight reduction, they are widely used in the fields of new energy vehicles, aerospace, storage and transportation and separation, etc. How to guarantee the integrity state has become an important topic in the research field of composite pressure vessels. In this paper, carbon fiber composite pressure vessel is selected as the research object, and the finite element is used to analyze the integrity of the vessel during the use of the fall and penetration of two typical working conditions, and combined with the Monte Carlo method for reliability analysis. Finally, the integrity state of the composite pressure vessel is evaluated by combining high-frequency signal analysis and background energy analysis during the grounding process. The results show that high-frequency signal analysis, background energy calculation, can evaluate its quality during the grounding process, and detect and analyze the damage in the vessel. Using high-frequency signal analysis to discriminate fiber breakage, the detailed letter of the failure is reacted by the background energy oscillation situation, and is used pressure vessel judging criteria.
Composite pressure vessel has the advantages of light weight and high strength, comes with the outermost layer of protective fibers, can be freely adjusted according to the use of winding form, and has the advantages of fatigue resistance. Compared with all-metal pressure vessels, composite pressure vessels are lighter in quality, higher in strength, longer in service life and more corrosion-resistant, which makes their use in engineering applications promising [1,2]. At present, fiber-wound gas cylinders have been widely used in various engineering industries Hydrogen storage cylinders are the core equipment to maintain the operation of clean energy freight, automotive, power generation and aviation. Nowadays, the mainstream composite cylinders on the market are mainly type III cylinders (fiber-wound metal liner), which have improved safety and quality compared with type I cylinders (made of all metal) and type II cylinders (fiber ring-wound metal liner) [3-5]. Moreover, compared with type I cylinders, composite cylinders with thin metal or non-metallic liners are lighter in quality and the cost of using them is reduced [6]. However, the inner liner of type III cylinder is metal. It is more prone to hydrogen embrittlement and fatigue failure. As a new type IV composite gas cylinder for hydrogen storage, its inner liner is non-metallic material, so the manufacturing cost is lower, no metal fragments will not be generated and no corrosion phenomenon occurs in metal pressure vessels, so carbon fiber fully wound type IV pressure vessel has gradually become a development trend [7-9].
However, composite pressure vessels are susceptible to damage by the impact of various objects in the external environment or accidents such as car accidents during transportation and use [10-11]. As a result, the load carrying capacity will be reduced or there will be hard-to-detect leakage, and the failure modes of the fiber-wound material layer of the composite pressure vessel mainly include fiber fracture, matrix cracking, and peeling. The damage modes of composite pressure vessels are various [12,13]. In particular, the anisotropy of composite pressure vessels caused by the inconsistent direction of the winding layer makes it more difficult to analyze the damage mechanism. Therefore, it is especially critical to carry out effective testing techniques to evaluate and monitor the damage of composite pressure vessels. Full performance [14,15].
In summary, composite pressure vessels in the process of engineering use, under the action of various factors, will lead to a variety of internal and external damage, and ultimately lead to its complete failure, the need to use accurate nondestructive testing means of composite pressure vessels to ensure the safety of its use [16]. Acoustic wave has the characteristics of easy excitation, strong propagation ability and high sensitivity to the discontinuities in the structure, which makes the acoustic emission technology for the nondestructive testing and evaluation of the complex plate structure has special advantages, and it is the most widely used nondestructive testing technology at present [17,18]. During the operation of the composite pressure vessel, the material structure damage and fatigue damage may have an effect on the propagation of acoustic wave, such as the amplitude, wave speed and frequency band distribution of acoustic emission as a non-destructive testing method, can effectively assess the overall structural integrity, modal acoustic emission is a signal processing technology based on waveform analysis, which can make the acoustic emission signal processing method more simple. Therefore, damage assessment of composite pressure vessels by modal acoustic emission is necessary [19,20].
Pressure vessel test is an important link in the research field of petroleum, chemical, energy and nuclear industries. At present, the pressure vessel test has a large scale, complex research objects, high test accuracy requirements, variable test environment, and long test cycle, so it is inevitable to introduce data acquisition technology into the research of pressure vessel test [21,22].
The study takes the fiber composite pressure vessel as the research object, establishes a three-dimensional finite element model of the composite pressure vessel by using ANSYS finite element analysis software, and analyzes its mechanical response under the two working conditions of drop and penetration. Then, for the randomness of material properties and structural dimensions during manufacturing, a reliability analysis method was established based on Monte Carlo sampling method to obtain the failure probability of composite pressure vessels under different loads. Finally, the staged hydrostatic loading experiments were conducted for intact and prefabricated defective composite pressure vessels to statistically compare the signals of two cylinders under the same loading conditions. The technical means such as high-frequency signal analysis and background energy calculation can be used to assess the integrity status during its grounding process.
Resin material: E-51 epoxy resin is used in this project.
Fiber material: The subject uses alkali-free glass fiber, the manufacturer is Nanjing Glass Fiber Institute.
Lining material: The subject uses plastic lining, the molding process is blow molding.
Film products molding methods are blow molding and casting two kinds of molding, casting refers to the material heated by the extruder melting and plasticizing in liquid form flow to the smooth rotation of the cooling rollers after the cooling of the molding method, the thickness of the product is very good uniformity. Blow molding refers to the plastic lining material in the extruder heated melt plasticization, through the die head barrel-shaped runner to obtain a cylinder-shaped mold, the mold for blowing, while hauling, cooling, winding mold made of cylindrical parts of the process. Compared with casting, the strength of blow molded film is better, and the equipment is simple and less investment.
Adhesive materials: Adhesive using high tenacity epoxy film, the film for the self-research products, its performance parameters shown in Table 1.
| Function | Test value |
| Density/(kg·m\(^-3\)) | 1250 |
| Modulus of elasticity/GPa | 3.3 |
| Poisson ratio | 0.28 |
| Pull shear strength/MPa | 50 |
The volume of the pressure vessel in the grounding process is 15.8L, which is a plastic-lined fiberglass-wound composite material component, the outer diameter of the pressure vessel cylinder is 220mm, of which the ideal thickness of the composite material cylinder is 1.52mm, and the ideal thickness of the plastic-lined liner is 1.22mm, and the maximal length is 520mm, of which the length of the cylindrical section is 368mm, and the spacing of two hoops and two brackets is 188mm, the working pressure of the gas cylinder is 1000\(\mathrm{\pm}\)10kPa, and the working temperature of the gas cylinder is (-40\(\mathrm{\sim}\)+80\(\mathtt{{}^\circ\!{C}}\)). The working pressure of the cylinder is 1000\(\mathrm{\pm}\)10kPa, and the working temperature of the cylinder is (-40\(\mathrm{\sim}\)+80)\(\mathtt{{}^\circ\!{C}}\).
Fiber Winding Machine
The winding process of this project chooses wet winding and uses a four-dimensional multi-station automatic winding machine, which has high stability and reliability in the winding process and can take into account both efficiency and accuracy in the line winding such as ring, spiral, stay, zero degree, etc. At the same time, this equipment also has relatively high automation and reliable operation. At the same time, the machine is characterized by high degree of automation, simple and reliable operation and convenient maintenance.
Testing Instruments
Zeiss field emission scanning electron microscope Merlin Compact, the use of Schottky field emission electron gun, can be through the secondary electron or backscattered electrons for conductive materials imaging, and very high resolution. It is widely used in chemical, metallurgical, material, physical, biological, mineral and other experiments to observe the surface morphology. At the same time, the SEM also comes with Oxford’s large window spectral detector and high-speed EBSD detector, which can be used to observe the surface properties while analyzing the composition of the experimental products in the micro-region and analyzing the orientation of the crystals.
Fourier Transform Infrared Spectrometer (FTIR) manufacturer is Thermo Fisher, model Nicolet is5003190721, mainly consists of infrared light source, beam splitter, sample cell, detector, interferometer, experimental recording system, computer information analysis and image analysis system, etc., the principle of which is mainly the different interference patterns of different groups, equipped with three kinds of test methods, namely, incidence, projection and reflection, which can analyze the composition of the experimental products. Test methods, which can qualitatively and semi-quantitatively analyze the functional groups or chemical bonds of experimental products.
In addition to the above main test equipment, the experimental and test equipment used in this project is shown in Table 2, and the experimental instruments without clear models are commissioned experiments.
| Device name | Specifications and models | Manufacturer |
| High temperature alternating box | SS-7126 | Shenyang Yihai Datong Equipment Co., LTD |
| Differential scanning calorimeter | DSC2500 | America waters |
| High temperature test box | GT-7001-HL | High-speed Railway Testing Instrument Co., LTD |
| Ultrasonic cleaner | 3K3210LHC | Shanghai Scientific Instruments Co., Ltd |
| Electronic balance | BSA224s | Saidolis |
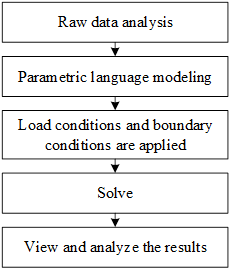
This project uses ANSYS software to perform finite element analysis and provide guidance for experiments. ANSYS software is universally applicable and is a widely used engineering software in the fields of mechanics, magnetic fields, electric fields, and fluids. It can effectively carry out evaluation, optimization, and analysis in the field of structural mechanics. The finite element analysis process is shown in Figure 1. Firstly, the geometric model is established and grid cells are generated through the pre-processing module parameterization (APDL) or intuitive modeling (workbench), after that, the analytical computation module is used to give the working conditions and carry out the analysis or coupling under different physical fields, and finally the results of the analytical computation are visualized through the post-processing module, and the different cloud diagrams and curves, etc., are outputted.
Monte Carlo method is a method of solving practical engineering problems related to random variables by numerical simulation. Numerical simulation of random variables is equivalent to a kind of “test”, so the Monte Carlo method is also called statistical test method. In ANSYS, Monte Carlo method is categorized into three types: direct method, Latin supraliminal method, and customized method, in which the Latin supraliminal method is more efficient than the direct method (avoiding repetitive sampling compared to the direct method). The number of simulations for the Latin supraliminal method is usually 20-40% less than the direct method to produce the same results.
The Monte Carlo method is widely applicable and, provided that the modeling is accurate and the number of simulations is high enough, the results obtained can be considered credible. The good performance of modern computers provides the hardware basis for the Monte Carlo method. Due to the systematic errors introduced by various assumptions made by other reliability analysis methods and their mathematical difficulties, Monte Carlo simulation is currently the only means to verify the correctness of reliability analysis results.
The permissible strains of the currently used carbon fiber resin matrix composite laminates under the design loads are: compression \(\varepsilon _{c} =4000\mu \varepsilon\), tension \(\varepsilon _{i} =5500\mu \varepsilon\), shear \(\gamma =7600\mu \varepsilon\). In this paper, it is assumed that the composite wrapped pressure vessel will not be allowed to exceed the design permissible strain in the annular direction of the composite wrapped layer (considering only the straight and simple section) in the process of its use, otherwise it is considered to be failing. Therefore, the failure criterion is: \[ \varepsilon _{\max } \ge \varepsilon _{s} . \tag{1}\]
In the above equation, \(\varepsilon _{\max }\) is the maximum value of the total annular strain of the composite winding layer during the use of the composite pressure vessel, and \(\varepsilon _{s}\) is the permissible tensile strain of the composite laminate under the design load, i.e., \(\varepsilon _{s}\) is taken to be 55,000 in this case. The limit state function is: \[\ Z(X)=\varepsilon _{s} -\varepsilon _{\max } , \tag{2}\] where \(Z(X)<0\) is the failure state. To find the reliability of a composite pressure vessel is to find the probability of \(Z(X)\ge 0\).
After the establishment of the geometric model of the composite pressure vessel, it is necessary to generate its finite element model ANSYS in order to analyze and calculate, and the method of generating the finite element model is to mesh the geometric model, as is known to all, for finite element analysis, the mesh delineation is good or bad, directly affecting the accuracy and speed of the solution. Meshing can be divided into three steps: defining cell properties (including cell type, real constants, material properties), defining mesh properties on the geometric model, and meshing.
Selection of cell type
Fiber layer cell type: In this paper, SHELL99 cell is selected to establish the fiber layer model. SHELL99 is an eight-node linear laminated structural shell cell, each node has six degrees of freedom, the translational degrees of freedom along the X, Y, and Z axes (UX, UY, and UZ) and the rotational degrees of freedom around the X, Y, and Z axes. When the number of material layers exceeds 250, the user can model the material by defining the material matrix. In addition, SHELL99 sets a node bias option by which the nodes of the cell can be biased to the bottom, middle and surface layers of the structure.
Lining layer cell type: According to the material properties of aluminum alloy, SOLID95 3D solid cell is chosen to establish the metal liner layer in this paper.SOLID95 cell is a higher-order cell form than SOLID45 (eight-node, three-dimensional solid cell). The cell can accommodate irregular cells with no change in its own accuracy, and is particularly suitable for models with curved boundaries. The cell consists of 20 nodes, each with three translational degrees of freedom (UX, UY, UZ) along the X, Y, and Z axes, and can form arbitrary three-dimensional spatial structures. In addition, SOLID95 has the capability of plasticity, expansion, stress stiffness, large deformation, creep and large strain.
Defining Material Properties
Aluminum liner is a plastic material, its stress-strain relationship is very complex, it is generally difficult to accurately simulate, in ANSYS using a simplified model, selecting the bilinear isotropic reinforcement option to represent the stress-strain curve of the aluminum liner.
Define cross-section properties
In this paper, the fiber layer of the composite pressure vessel is wound linearly in the barrel section by a combination of ring winding and helical winding, and only helical winding is used in the head section.
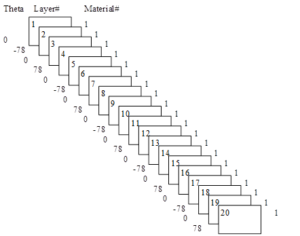
The calculation formula for the spiral winding angle of the fiber in the barrel section is: \[ \alpha _{0} =\arcsin (\frac{r_{0} }{R} ) , \tag{3}\] where \(R\) is the outer radius of the barrel of the metal liner and \(r_{0}\) is the outer radius of the pole hole of the metal liner. Substituting the geometric dimensions of the model into Eq. 3, we can obtain \(\alpha _{0} =12.3{}^\circ\). Taking the rounding treatment, the fiber layup in the barrel section is: \[ \begin{array}{l} {[90^{0} /-12^{0} /90^{0} /12^{0} /90^{0} /-12^{0} /90^{0} /12^{0} /90^{0} /} \\ {-12^{0} /90^{0} /12^{0} /90^{0} /-12^{0} /90^{0} /-12^{0} /90^{0} /12^{0} ]} \end{array} . \tag{4}\]
In the SHELL99 linear laminated shell unit, the winding angle of the fibers can be defined by changing the real constant THETA, which is the orientation angle of the ply, the angle of the ply coordinate system with respect to the unit coordinate system, and the size is equal to the angle between the X-axis of these two coordinate systems. Since the X-axis of the unit coordinate system is perpendicular to the axial direction of the composite pressure vessel, the size of the orientation angle of the layer is equal to the residual angle of the fiber winding angle. Figure 2 shows the layup of fibers in the barrel section.
Another important parameter of the composite pressure vessel is the thickness of the layup, and the fiber thickness of the cylinder section is calculated by the formula: \[ \left\{\begin{array}{l} {t_{f\alpha } =\frac{RP_{\max } }{2\bar{\varepsilon }E_{f} \cos ^{2} \alpha _{0} } } \\ {t_{f\theta } =\frac{RP_{\max } }{2\bar{\varepsilon }E_{f} } (2-\tan ^{2} \alpha _{0} )} \end{array}\right. , \tag{5}\] where \(R\) is the outer radius of the barrel of the metal liner, \(\bar{\varepsilon }\) is the ultimate strain value of the fibers, \(E_{f}\) is the modulus of elasticity of the fibers, \(\alpha _{0}\) is the helically wound angle of the barrel section, and \(P_{{\rm max}}\) is the bursting strength. By calculation, the total thickness of annularly wound fibers is 3.0 mm, and the total thickness of helically wound fibers is 2.0 mm. In SHELL99 linear laminated shell unit, the thickness of fibers can be defined by changing the thickness of the four nodes of each unit I, J, K and L.
The fiber thickness of the head section is calculated by the formula: \[\ t_{f} =\sqrt{\frac{R^{2} -r_{0}^{2} }{r^{2} -r_{0}^{2} } } t_{f\alpha } . \tag{6}\]
Formula for calculating the angle of fiber winding of the head section: \[ \alpha =\arcsin (\frac{r_{0} }{r} ) . \tag{7}\]
According to the above two equations, the fiber thickness and fiber winding angle can be calculated as long as \(r\) is determined, and the functions NX(i), NY(i), NZ(i) are provided in ANSYS to obtain the coordinates of the nodes, which in turn determines the corresponding radius of the parallel circle of the node \(r\), and then the THETA of the individual units of the head portion and the thicknesses of the four nodes I, J, K, and L can be defined. The finite element model of the composite pressure vessel is shown in Figure 3.
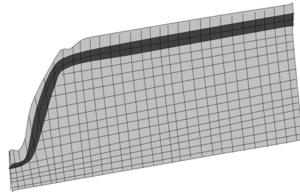
In the transition part of barrel and head section, since the fiber is spiral wound plus annular winding in the barrel section and only spiral winding in the head section, in order to eliminate the sudden change in this part, the annular winding layer is set to disappear gradually in the barrel section in the transition region, in order to facilitate the view of stress-strain in the results, it is assumed that the annular winding exists in the head section, but its thickness is zero.
In the transition section of the head and pole hole, the fiber accumulation phenomenon occurs here in the mesh analysis, and in the manufacturing process, the expansion technology is generally used to eliminate the accumulation phenomenon, and here we assume that the thickness of the fiber is kept at the same value, but the fiber winding angle is still varied with the radius of the parallel circle.
The main purpose of finite element analysis is to examine the mechanical response of a member or structure under certain loading conditions. In order to make the results of the solution accurate, the applied load conditions must be consistent with the actual situation of the member or structure. In structural analysis, the loads are mainly displacement boundary conditions (including specified displacements, symmetric boundary conditions or antisymmetric boundary conditions), concentrated loads (forces and moments), surface loads (mainly pressure) and so on. The load conditions imposed by the finite element model of the composite pressure vessel are mainly symmetric constraints on the three axial profiles, circumferential constraints imposed on the end faces of the pole holes, i.e., the pole hole circle will not become larger, and uniform pressure is applied to the inner surface of the metal liner.
When analyzing the drop impact process, the free fall process of the model can be ignored because it does not affect the model, and the model is directly given a velocity of 4.88 m/s obtained after a free fall process of 1.2 m. Figure 4 shows the global energy characteristic curves of the model system for the drop simulation, in which curve 1 indicates the kinetic energy of the system, curve 2 indicates the internal energy of the system, and curve 3 indicates that the total energy of the system is equal to the total sum of the kinetic energy of the system and the internal energy of the system. The total energy of the system is equal to the sum of the kinetic energy and the internal energy of the system. From the figure, it can be seen that the kinetic energy of the system decreases, the internal energy increases, and the total energy of the system gradually increases, which is due to the fact that the kinetic energy of the system decreases and deforms due to the ground resistance in the process of fall and impact, and the kinetic energy and gravitational potential energy are converted into internal energy, resulting in the increase of the internal energy of the system.
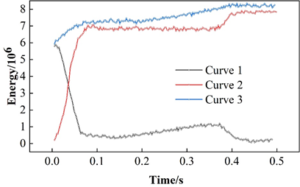
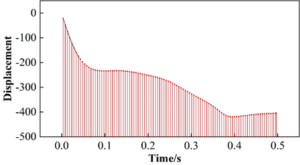
Figure 5 shows the overall center of gravity y-displacement curve, from the overall center of gravity y-displacement curve can be seen, in 0.37s when the center of gravity of the system to reach the lowest point, this time the system gravitational potential energy is no longer reduced, the system of internal energy and kinetic energy and the sum of the maximum value. Combined with the cloud diagram, it can be seen that the maximum stress borne by the container when falling to 0.37 is less than the strength limit of the material 22.86MPa, and the container will enter the plastic stage and plastic deformation occurs in the process of impact, and its maximum equivalent effect becomes 126%, which is less than the ultimate strain of the material 133%, so the structure is safe and reliable. When the stress of the basket reaches the yield stress and enters the plastic stage, the top cover of the container is still within the elastic range.
In this paper, a 5.0 m penetration simulation is also carried out, the diameter of the penetration steel bar is 3.3 cm, the length is 258 mm, one end is hemispherical, the mass is 5.8 kg. The bar falls freely and vertically at the center of the weakest part of the model, considering that the stiffness of the bar is much larger than that of the container, so in order to simplify the calculation, the bar can be set as a rigid body. Figure 6 shows the penetration global energy characteristic curve of the container during the grounding process. From the figure, it can be seen that the energy change can be divided into three stages: the first stage of the total energy of the system increases, the kinetic energy increases, and the internal energy is zero, which is due to the center of gravity position of the system subjected to impact is first shifted downward, the gravitational potential energy decreases resulting in an increase in the kinetic energy of the system, the second stage of the system due to the resistance to do work to generate the deformation, therefore, the total energy, kinetic energy and internal energy are increased; the third stage of the system due to the kinetic energy and the gravitational potential energy are constantly converted In the third stage, as the kinetic energy and gravitational potential energy of the system are continuously converted into elastic potential energy, which eventually causes the system to vibrate, so the energy of the system starts to oscillate with the center of gravity position.

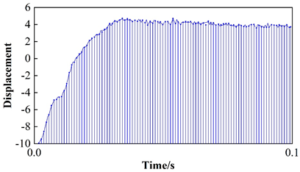
Figure 7 is the velocity response curve of the impact bar, the speed of the impact bar first extends the y-axis negative direction increases, and then reduced, the impact bar speed becomes zero near 0.24s, and then extends the y-axis positive direction increases, and then reduces to zero after the start of the y-axis negative direction increases, the reciprocal process shows that the system energy changes with the impact bar speed change and the center of gravity of the system changes up and down the change of the center of gravity position is consistent.
In addition, between 0.245 \(\mathrm{\sim}\) 0.258s the velocity of the impact rod becomes zero, at this time the impact force reaches the maximum value, the container is subjected to the maximum stress, but also the most dangerous state. Combined with the cloud diagram, it can be seen that the maximum stress borne by the container in the impact process is 20.11MPa, which is smaller than the yield stress of 22.86MPa, and the maximum average strain is 73.1%, which is smaller than the limit strain of the composite material by 133%, and the container won’t be penetrated, so the design meets the requirements of safety performance.
For the reliability analysis of composite pressure vessels, mastering and understanding the random distribution of various basic design variables is a prerequisite for more safe and reliable applications. The fiber strength property of fiber-wound reinforced composites is the most important design variable, and the strength-stress calculation model, strength criterion and the establishment of limit state equation used in the analysis process should be calculated and analyzed based on the basic performance parameters of the composite winding layer in the end. A large number of tests are carried out on carbon fiber/epoxy composite unidirectional plate to determine the statistical characteristics of random distribution of composite material properties. Considering the influence of process error on the structural dimensions, the main consideration is the random distribution of the thickness of straight section of the inner liner, the radius, and the thickness of the winding layer, and the reliability analysis of the composite material pressure vessel. The random distribution of each basic design variable is shown in Table 3. In the table, \(t_{{}^{hf} }\) represents the thickness of annular winding layer, \(t_{sf}\) is the thickness of spiral winding layer, \(R\) is the radius of inner liner, and \(t_{l}\) represents the thickness of inner liner.
| Design variable | Mean | Standard error | Coefficient of variation |
| E\({}_{1}\) | 133.924GPa | 6.191GPa | 0.03518 |
| E\({}_{2}\) | 8.839GPa | 0.351 | 0.03059 |
| E\({}_{3}\) | 8.848GPa | 0.346 | 0.04259 |
| G\({}_{12}\) | 4.457GPa | 0.138 | 0.03146 |
| Pr\({}_{12}\) | 0.339 | 0.022 | 0.06752 |
| X\({}^{t}\) | 1786.999MPa | 254.998MPa | 0.1477 |
| X\({}^{c}\) | 1184.993MPa | 159.996MPa | 0.13302 |
| Y\({}^{t}\) | 58.361MPa | 6.501MPa | 0.11238 |
| Y\({}^{c}\) | 249.958MPa | 18.592MPa | 0.06637 |
| S\({}_{12}\) | 92.601MPa | 3.828MPa | 0.04925 |
| S\({}_{13}\) | 106.93MPa | 2.602MPa | 0.02034 |
| t\({}_{hf}\) | 5.717mm | 0.0913 | 0.0134 |
| t\({}_{sf}\) | 6.168mm | 0.0752 | 0.0087 |
| R | 200.004mm | 0.852mm | 0.0072 |
| t\({}_{l}\) | 1.396mm | 0.052 | 0.0287 |
In this paper, we adopt the Latin superlattice method to sample the above random variables for 1000 times, and simulate the failure process of composite pressure vessel by combining with finite element analysis. The sampling process of the fiber direction strength of the winding layer is shown in Figure 8, in which the blue line represents the possible upper and lower limits of the sampling value, and the black line represents the sampling mean value, with the increase of the sampling times, the sample mean value will change with the change of the upper and lower limits of the sampling value, and the trend of the sample mean value will converge gradually and the curve tends to be horizontal from the 500th sampling time, and the mean value is 0.1885E+10, which indicates that the Monte Carlo sampling process of the cyclic sampling is sufficient to ensure the probabilistic convergence of the reliability analysis.

Through the reliability analysis method established in this paper, while considering the randomness of the design variables of the inner liner and the winding layer, the burst pressure of the structure was calculated and the burst pressure of the structure was counted, and the results of the burst pressure distribution are shown in Figure 9. The results show that the burst pressure of this type of fiber-wound composite pressure vessel is distributed between 76MPa and 104MPa, with most of the failure loads distributed between 86MPa and 93MPa, and the frequency of failure loads between 76MPa and 86MPa gradually increases, and the frequency of failure loads between 93MPa and 104MPa gradually decreases, and the overall distribution of failure loads is basically in line with the normal distribution trend. The overall distribution of the failure loads is basically in line with the normal distribution trend.

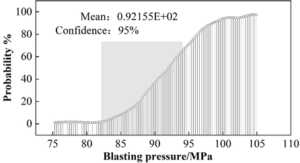
In the statistical burst load distribution results based on the establishment of the relationship between the burst load and the probability of failure, the results are shown in Figure 10, the results show that the failure probability of this type of composite pressure vessel is close to 0 when less than 76MPa, in the process of load from 76MPa to 84MPa, the probability of failure from 0 to 11%, and the growth rate increases gradually. After the load reaches 84MPa, the growth rate of the failure probability no longer increases, and becomes a uniform growth, when the load increases from 84MPa to 94MPa, the probability of failure increases from 11% to 86% at a uniform rate. When the load reaches 94 MPa, the growth rate of failure probability gradually slows down, until the load reaches 104 MPa, the failure probability of the structure is close to 100%.
Based on the reliability analysis results of the sensitivity analysis of each random variable affecting the bursting pressure, the results of the bursting pressure sensitivity analysis as shown in Table 4, the correlation coefficient between the fiber direction strength and the bursting pressure is close to 1.0, indicating that the fiber direction strength is the most significant variable affecting the bursting pressure, and the correlation coefficients of the other variables and the bursting pressure in descending order of the fiber direction strength, the thickness of the annular layer, the thickness of the helix layer, the strength of the in-plane matrix direction and the radius of the liner. Layer thickness, modulus of elasticity in the in-face matrix direction, strength in the in-face matrix direction, and radius of the liner. The correlation coefficients reflect the degree of linear correlation between the variables. As the random variable increases, the burst pressure increases, and the two are positively correlated. A correlation coefficient greater than 0.95 indicates a significant correlation between the two, such as fiber orientation strength. Correlation coefficient greater than 0.5, the two moderately correlated, such as fiber direction elastic modulus, correlation coefficient is less than 0.3 indicates that the two are not correlated, such as in the face of the matrix direction elastic modulus and strength. As the radius of the inner liner increases, the burst pressure will become smaller, when the two become negatively correlated.
| Sensitivity | Correlation coefficient | |
| X\({}^{t}\) | 1.00 | 0.995 |
| E\({}_{1}\) | 0.485 | 0.513 |
| t\({}_{hf}\) | 0.385 | 0.469 |
| t\({}_{sf}\) | 0.289 | 0.375 |
| E\({}_{2}\) | 0.255 | 0.248 |
| Y\({}_{t}\) | 0.188 | 0.185 |
| R | -0.008 | -0.008 |
In order to evaluate the integrity state of carbon fiber fully wound type III bottles under multi-stage hydraulic loading conditions, A bottle aluminum alloy (A6061), B bottle (carbon fiber + glass fiber) were selected to be tested under 45MPa and 50MPa hydraulic pressure, respectively. Experiments in order to conduct a comparative analysis to confirm the accuracy of the health assessment of composite pressure vessels proposed in this paper on the experimental cylinders prefabricated unacceptable defects, A bottles to maintain the existing state, B bottles in the bottle straight section of the processing of 40 \(\mathrm{\times}\) 2.0 mm carved groove, so that the carbon fiber exposed, the 2 cylinders to compare the test situation.
For the integrity assessment of composite gas cylinders, acoustic emission signals were collected during the loading of the cylinders and the energy ratios were calculated to determine whether high-frequency events occurred. The analysis of fiber breakage was only performed during the holding pressure period, and based on the amplitude plots during the holding pressure period, it can be seen that the low number of signals during the holding pressure periods of 32 and 48 MPa suggests that the cylinders were relatively stable at that time. For further analysis, signals from the 15, 70, 85, 100, and 117.5 MPa holding pressures were selected for high frequency event analysis. Specifically, the data was imported into MATLAB and the determination method mentioned was followed in order to determine if a high frequency event occurred. The analysis of the high-frequency signals during the pressure-holding moments of the composite type III cylinder is shown in Figure 11. The results show that during the pressurization of the cylinder, when the air pressure is added to the late rated pressure, the energy of the signal begins to rise significantly and a large number of high-frequency signals begin to appear, which indicates that a large number of fibers have broken inside the cylinder.
At the same time, at 105 MPa holding pressure, the three discriminating criteria also far exceeded the standard threshold for the occurrence of high-frequency events, thus further proving the existence of high-frequency events and the occurrence of fiber damage inside the cylinders, and this analysis is in line with the cumulative energy curves plotted above. In summary, this method has successfully detected the fiber damage of composite gas cylinders during the pressurization process, and provides an important reference for the safe use of gas cylinders.
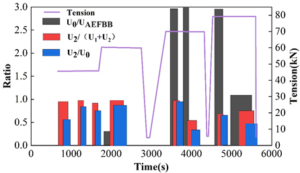
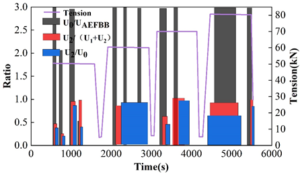
Because the pressure vessel is unstable and has a lot of noise during the pressurization and unloading phases of the hydrostatic loading experiment, the acoustic emission signals from the holding pressure moment were selected and analyzed after 50 dB filtering. Matlab software is used to write the corresponding calculation program to analyze the high-frequency signals of the signal data of gas cylinders A and B at the holding pressure moment, and the analysis results are shown in Figure 12 and 13, which show that the rectangles of the three colors at a certain moment exceed the dotted line criterion of the corresponding color, which proves that there are high-frequency signals. B bottle in the 55MPa holding pressure when the high frequency signal, and thereafter pressure after the moment of holding pressure there are high-frequency signals, that is, in the B bottle of its own rated water pressure pressure under the high-frequency signal. In the engineering application of composite pressure vessel hydraulic pressure detection, only the water pressure will be added to the rated water pressure test pressure, and B bottle in the rated water pressure pressure holding pressure when the high frequency signal. The calculated results correspond to the cumulative energy calculation results, which can be high-frequency signal analysis can accurately evaluate the integrity of the composite material pressure vessel.
To calculate the background energy, a window is added to the acoustic emission signal and the minimum value of the average energy within the window is calculated. As an example, in this chapter of the study, the background energy was analyzed for a gas cylinder undergoing a hydrotest. By moving a window of length 100 \(\mu\)s in 5 \(\mu\)s steps through the waveform signal, the average energy in each window was calculated, and the smallest window average energy was taken as the background energy.
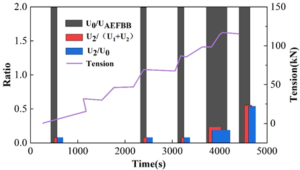
The results of the background energy calculation of the composite material type III bottle are shown in Figure 14, the blue box point is the background energy at the moment of holding pressure, and the background energy rises during pressurization to 50 MPa and 72 MPa, and decreases during holding pressure, as the pressurization has been stopped. In the process of pressurization to 105 MPa, the background energy suddenly increased, and the background energy oscillated during the pressure-holding process and the value of the oscillation ratio was greater than 4, indicating that a large amount of fiber damage appeared. The high frequency analysis of the cumulative energy and holding time described above also demonstrated that there was a rapid increase in cumulative energy after pressurization to 100 MPa, indicating a large number of fiber breaks.

A bottle background energy calculation results shown in Figure 15, the blue box point part of the figure for the holding pressure moment background energy, the red part of the pressurized moment background energy, in the analysis of the background energy whether the background energy oscillation phenomenon needs to be selected to analyze the background energy of the holding pressure moment background energy analysis, in the holding pressure of 62MPa began to appear background energy oscillation, shown in the high point of 1.68624 \(\mathrm{\times}\) 10\({}^{-4}\), the low point of 2.45286 \(\mathrm{\times}\) 10\({}^{-5}\) difference is greater than 4 times, the beginning of the background energy oscillation phenomenon. The maximum and minimum values of the background energy are greater than 4, and the oscillation phenomenon is more intense.
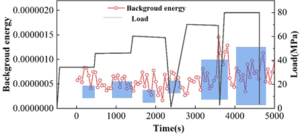
The background energy calculation results of bottle B are similar to those of bottle A. However, it is obvious that the background energy oscillation starts to appear at 40MPa holding pressure, and the difference between the two is more than four times. In the subsequent moments of holding pressure, there are background energy oscillations, and the oscillation phenomenon is gradually intense. This is consistent with the cumulative energy calculations, which show that a large number of fibers were broken.
The study analyzes the finite element analysis of the performance of the pressure vessel during the grounding process and evaluates the integrity of the composite pressure vessel by combining the high-frequency signal analysis and the background energy analysis. This paper draws conclusions mainly as follows:
container for 1.2m drop, the basket and container will occur plastic deformation, the container will not destroy the leakage, the container is safe and reliable, the steel rod 5m penetration to fill the container, but also will not penetrate the container, the container is safe, the container’s free-fall, penetration performance requirements to fully meet the requirements of the grounding process working conditions.
structure to withstand the load in less than 76MPa, the structure of the failure probability of 0, with the increase in the load structure of the failure probability of increasing, and the growth rate curve presents a non-linear characteristics, the structure to withstand the load of 104MPa, the structure of the failure probability of close to 100%. Finally, a sensitivity analysis of the random variables affecting the bursting pressure was carried out, and the results showed that the strength of the fiber direction is the most significant factor affecting the bursting pressure.
A bottle (intact) in the holding pressure of high-frequency signal and background energy ratio greater than four times the phenomenon of background energy oscillation, B bottle (prefabricated defects) in the holding pressure of high-frequency signal and background energy oscillation, and the signal amplitude, empirical modal analysis and cumulative energy analysis results in line with. This is a clear indicator of a gradual decrease in the local load-bearing capacity of the material. Therefore, high-frequency signal analysis and background energy oscillation effects are also important for assessing cylinder integrity.
Azeem, M., Ya, H. H., Alam, M. A., Kumar, M., Stabla, P., Smolnicki, M., … & Mustapha, M. (2022). Application of filament winding technology in composite pressure vessels and challenges: a review. Journal of Energy Storage, 49, 103468.
Harada, S., Arai, Y., Araki, W., Iijima, T., Kurosawa, A., Ohbuchi, T., & Sasaki, N. (2018). A simplified method for predicting burst pressure of type III filament-wound CFRP composite vessels considering the inhomogeneity of fiber packing. Composite Structures, 190, 79-90.
Zu, L., Xu, H., Wang, H., Zhang, B., & Zi, B. (2019). Design and analysis of filament-wound composite pressure vessels based on non-geodesic winding. Composite Structures, 207, 41-52.
Alam, S., & Divekar, A. (2017, November). Design optimisation of composite overwrapped pressure vessel through finite element analysis. In ASME International Mechanical Engineering Congress and Exposition (Vol. 58448, p. V009T12A063). American Society of Mechanical Engineers.
Onder, A., Sayman, O., Dogan, T., & Tarakcioglu, N. (2009). Burst failure load of composite pressure vessels. Composite structures, 89(1), 159-166.
Chang, W., Liu, Y., Xiao, Y., Yuan, X., Xu, X., Zhang, S., & Zhou, S. (2019). A machine-learning-based prediction method for hypertension outcomes based on medical data. Diagnostics, 9(4), 178.
Sulaiman, S., Borazjani, S., & Tang, S. H. (2013, December). Finite element analysis of filament-wound composite pressure vessel under internal pressure. In IOP Conference Series: Materials Science and Engineering (Vol. 50, No. 1, p. 012061). IOP Publishing.
Öztas, K. A., Kunze, K., Jois, K., Sackmann, J., Zaremba, S., & Ruf, M. G. (2022). A numerical approach to design a type II box-shaped pressure vessel with inner tension struts. International Journal of Hydrogen Energy, 47(6), 3927-3938.
Ebermann, M., Bogenfeld, R., Kreikemeier, J., & Glüge, R. (2022). Analytical and numerical approach to determine effective diffusion coefficients for composite pressure vessels. Composite Structures, 291, 115616.
Kumar, A. E., Santosh, R. K., Teja, S. R., & Abishek, E. (2018). Static and dynamic analysis of pressure vessels with various stiffeners. Materials Today: Proceedings, 5(2), 5039-5048.
Chou, H. Y., Mouritz, A. P., Bannister, M. K., & Bunsell, A. R. (2015). Acoustic emission analysis of composite pressure vessels under constant and cyclic pressure. Composites Part A: Applied Science and Manufacturing, 70, 111-120.
Zhang, L., Qu, X., Zhao, Z., Zhang, H., Lu, S., & Wang, X. (2022). Health monitoring of composite pressure vessels through omnidirectional buckypaper sensor array. Applied Physics A, 128(3), 178.
Yeh, M. K., & Liu, T. H. (2017). Finite element analysis of graphite/epoxy composite pressure vessel. Journal of Materials Science and Chemical Engineering, 5(7), 19-28.
Jeong, S., & Hwang, T. (2018). Research on laminate design parameters to maximize performance index of composite pressure vessel. Journal of the Korean Society of Propulsion Engineers, 22(3), 21-27.
Nguyen, B. N., Roh, H. S., Merkel, D. R., & Simmons, K. L. (2021). A predictive modeling tool for damage analysis and design of hydrogen storage composite pressure vessels. International Journal of Hydrogen Energy, 46(39), 20573-20585.
Rafiee, R., & Torabi, M. A. (2018). Stochastic prediction of burst pressure in composite pressure vessels. Composite Structures, 185, 573-583.
Farhood, N. H., Karuppanan, S., Ya, H. H., & Baharom, M. A. (2017, December). Burst pressure investigation of filament wound type IV composite pressure vessel. In AIP Conference Proceedings (Vol. 1901, No. 1). AIP Publishing.
Alcántar, V., Aceves, S. M., Ledesma, E., Ledesma, S., & Aguilera, E. (2017). Optimization of Type 4 composite pressure vessels using genetic algorithms and simulated annealing. International journal of hydrogen energy, 42(24), 15770-15781.
Lainé, E., Dupré, J. C., Grandidier, J. C., & Cruz, M. (2021). Instrumented tests on composite pressure vessels (type IV) under internal water pressure. International Journal of Hydrogen Energy, 46(1), 1334-1346.
Klute, S. M., Metrey, D. R., Garg, N., & Rahim, N. A. A. (2016). In-situ structural health monitoring of composite-overwrapped pressure vessels. SAMPE J, 52(2), 7-17.
Macri, M. F., Littlefield, A. G., Root, J. B., & Smith, L. B. (2018, July). Modeling Automatic Detection of Critical Regions in Composite Pressure Vessel Subjected to High Pressure. In Pressure Vessels and Piping Conference (Vol. 51623, p. V03AT03A005). American Society of Mechanical Engineers.
Musthak, M., Valli, P. M., NarayanaRao, S., & Madhavi, M. (2017). Prediction of structural behavior of FRP pressure vessel by using shear deformation theories. Materials Today: Proceedings, 4(2), 872-882.