It determines which sports industry subindustries are appropriate for the selected model prefecture-level cities and what strategies or layouts the selected model prefecture-level cities employ in developing a sports industry. Under this premise, the research mainly focuses on the sports industry of a model prefecture-level city as the research object to conduct analysis. It organizes information about the industrial environment of the city through literature review and expert interviews and collects data on 63 sports events held in 2019 through field surveys of 100 stadiums and 69 sports training institutions. Traditional federated learning algorithms and frameworks perform badly in analyzing the sports industry structure, industrial layout policy selection, and other data-related scenarios. They also have significant shortcomings in terms of protection for privacy and communication efficiency. This paper mainly focuses on and enhances federated learning in the context of the Non-IID problem. Experimental results reveal that it is possible to increase the initial baseline of the global model by raising the complexity of the local sports industry structure and industrial layout policy selection models. Furthermore, proper local learning rates can improve the algorithm performance on Non-IID data and thus make the adaptive adjustment of the learning rate particularly valuable. In addition, by sharing specific datasets, the degree of Non-IID in the sports industry structure and industrial layout policy selection data can be reduced.
The sports industry is also part of the “five happiness industries.” The interactive development between the sports industry and urbanization has increasingly become important under the influence of national strategies, such as “Fitness for All” and “Healthy China.”.
From the point of view of favorable policies on the development of sports, measures like “encouraging large sporting goods manufacturing enterprises to increase investment in research and development” and “reducing or exempting corporate income tax for sporting goods manufacturing enterprises recognized as high-tech” have driven rapid growth of the sporting goods manufacturing industry and developed broad development opportunities for it. Favorable policies have also profoundly influenced the development of the sports competition and performance industry [1].
The sports industry is regarded as one of the most dynamic sunrise industries. It is among the fastest-growing sectors in the post-financial-crisis period and one of the key sectors globally to counter weak economic growth, with its development ranking among the top 10 sectors in national economic development [2,3]. It is commonly associated with manufacturing and traditional service industries that foster employment and boost national well-being. In developed economies, the industry’s total output usually runs between 1% and 3% of GDP every year. For example, according to estimates in 2015, the total value of the U.S. sports industry was $498.4 billion, consisting of about 2.6% of GDP.
Overall, in line with its structure, industrial distribution, and federal online policy options, this sports industry should open up significant opportunities for growth in absolute terms and as a contributor to GDP. see [4-6].
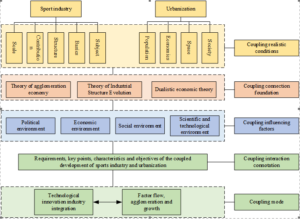
On one hand, we can specify the concrete conditions and their relations. On the other hand, by investigating the influencing factors and interactive connotations, we can explain the connection between the sports industry and urbanization. We can also analyze the interaction mechanism in the coupled system [7]. In this regard, this model is constructed from the perspective of “realistic conditions – connection basis – influencing factors – interactive connotation – connection mode,” as shown in Figure 1.
In this model, N data owners are defined {C1, C2, C3, …, CN}, all data holders want to integrate their own data {D1, D2, D3, …, DN} Privacy protection or even regulatory constraints, so as to complete the macro model design of sports industry structure and industrial layout: \[\label{GrindEQ__1_} \left\{\begin{array}{l} {Y_{1} =a_{11} X_{1} +a_{12} X_{2} +a_{13} X_{3} +\ldots +a_{1m} X_{m} }, \\ {Y_{2} =a_{21} X_{1} +a_{22} X_{2} +a_{23} X_{3} +\ldots +a_{2m} X_{m} }, \\ {\cdots, } \\ {Y_{3} =a_{31} X_{1} +a_{32} X_{2} +a_{33} X_{3} +\ldots +a_{3m} X_{m} }. \end{array}\right.\tag{1}\]
If the \(\left|V_{{\rm fed\; }} -V_{sum} \right|<\delta\) condition is valid, the following formula can be used to calculate the complexity of sports industry layout: \[\begin{equation} \label{GrindEQ__2_} X_{i} =X_{j} ,\quad Y_{i} =Y_{j} ,\quad I_{i} \ne I_{j} ,\quad \forall\,\,\, D_{i} ,D_{j} ,\,\,\, i\ne j . \end{equation} \tag{2}\]
The model features are shown in Figure 2:

After determining the horizontal complexity of the sports industry layout, then the vertical depth has to be assessed as well. Users of institutions in sports cover most of the region’s residents, causing extensive overlap among user spaces between institutions. For instance, banks house all data of income by users, while companies handling sports businesses keep records of users’ surfing and buying history. Although their feature spaces are quite different, it is possible to merge these features effectively for modeling. Assuming that both parties wish to build a product purchase prediction model, vertical federated learning collects all these different features and applies the privacy protection mechanisms to calculate training loss and gradients. This problem is depicted in Figure 3. From this, it is also called feature-based federated learning, see for example [8,9].
In summary, the vertical federated learning scenario is as follows:
\[\begin{equation} \label{GrindEQ__3_}
X_{i} \ne X_{j} ,\quad Y_{i} \ne Y_{j} ,\quad I_{i} =I_{j} ,\quad \forall D_{i} ,D_{j} ,\quad i\ne j .
\end{equation} \tag{3}\]

This section introduces the whole federal learning system, based on these solutions, and applied to the sports program. The system aims to gather many participants in the sports industry to formulate modeling plans and finally standardize the modeling, improve the planning ability of the sports industry, and reduce project costs [10]. As illustrated in Figure 4, the entire system has been broken down into four layers: inconsistent data access, data processing, operator layer, ranking layer among the participants, and cross learning.
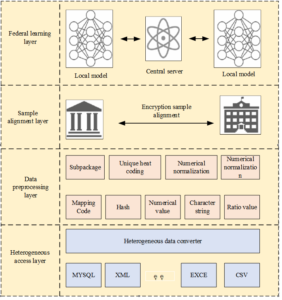
The heterogeneous data access layer transforms unstructured and inconsistent data storage formats within participants into a unified, structured big data platform. This platform could provide a consistent Hive interface to external systems for business and technical personnel to uniformly analyze. The data preprocessing layer, built upon the heterogeneous data access layer, encapsulates common data preprocessing methods like box splitting, one-hot encoding, numerical normalization, and missing value imputation. Within this layer, original values, strings, and ratio values are transformed into features suitable for input into the sports industry layout model through operator transformation. This separation of data preprocessing from the sports industry layout model makes the ability to iterate algorithms rapidly for modelers significantly enhanced.
Above this layer is the sample alignment layer, where parties agree to training samples without exchanging original data and ensures the parties are in agreement for modeling; this is done through asymmetric encryption technology. Once all parties determine the samples for modeling, joint modeling is done using the federated learning approach. The aggregation and distribution of gradients are facilitated by a trusted third-party platform, as illustrated in Figure 5.

From the view of systematology, the regional sports industry system is a complete and complex structure at many levels. Assessment of its development potential requires investigation of such complexity from several viewpoints and levels [11,12]. Such a variety of influences includes social and cultural development, customs, and other systems in the region. All these dependencies should be considered within any scientific evaluation of the sports industry’s potential.
It is important to note that the potential of the sports industry is not only determined by internal factors but also by its interaction with other regional systems. The sports diamond model divides the potential of the sports industry into three main areas: supply, demand, and integration. These are shown in Figure 6 to depict the depth and linkages of the sports industry to some extent.
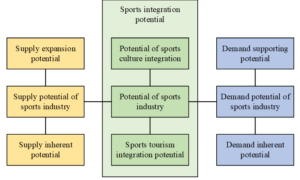
In combination with the interview with some experts and scholars, the specific situation of Liaoning and the particularity of the sports industry, as shown in Table 1.
| Level I indicators | Secondary indicators | Index name and number | Company | |
|---|---|---|---|---|
| Evaluation index system of sports industry potential | Supply potential | Supply inherent potential | GDP (100 million yuan) (D1) | RMB100mn |
| Sports Industry Planning (100 million yuan) (D2) | RMB100mn | |||
| Number of employees in sports industry (person) (D3) | People | |||
| Number of sports industry policies (D4) | Individual | |||
| The government’s position on the sports industry (D5) | Nothing | |||
| Policy support for sports industry (D6) | Nothing | |||
| Number of site facilities (D7) | Individual | |||
| Area of site facilities (D8) | Square meter | |||
| Number of sports organizations (D9) | Individual | |||
| Number of patents submitted (D10) | Individual | |||
| Scientific research investment (D11) | Zhang (volume) | |||
| Supply expansion potential | Number of sports websites (D12) | Individual | ||
| Number of athletes above Grade A (D13) | Individual | |||
| Number of referees above Grade I (D14) | Individual | |||
| Number of international and national sports events (D15) | Individual | |||
| Number of medals won in international and national sports events (D16) | Individual | |||
| Ratio of the number of college students to the total number of college students (D17) | Percentage | |||
| Demand potential | Demand inherent potential | Number of social sports instructors (D18) | Individual | |
| Population of mass sports (D19) | Individual | |||
| Sales of sports lottery (100 million yuan) (D20) | RMB100mn | |||
| Community health service institutions (D21) | Individual | |||
| Participation rate of residents in sports and fitness activities (D22) | Percentage | |||
| Satisfaction rate of residents’ physical fitness activities (D23) | Percentage | |||
| Awareness rate of residents’ physical fitness activities (D24) | Percentage | |||
| Demand supporting potential | Per capita disposable income in cities and towns (D25) | Element | ||
| Urban per capita consumption expenditure (D26) | Element | |||
| Disposable time of urban residents (D27) | Hour | |||
| Savings of urban residents (D28) | Element | |||
| Total regional population (D29) | Individual | |||
| Total urban population (D30) | Individual | |||
| Number of students in institutions of higher learning (D31) | Individual | |||
| Integration potential | Tourism integration | Individual | ||
| 10000 person times |
This paper screened the indicators by distributing the indicators listed in Table 1 to relevant experts, scholars, and professionals who were actively engaged in the management of sports industries, including model prefecture-level municipal sports bureaus, the Shenyang Municipal Sports Bureau, and the Dalian Municipal Sports Bureau. The Delphi method combined with email communication was implemented in the process. Experts were consulted to gauge how important and sensible the chosen indicator system appeared based on their theory as well as professional experience.
The particular process included the following: Experts were asked to choose 30–40 indicators from a total of 41 indicated indicators that best reflect the potential of the sports industry in the model prefecture-level cities. A questionnaire was distributed to 25 experts to rate all 41 indicators. If less than 30% of the experts chose an indicator, it was excluded.
Based on experts’ comments, and calculating the membership degree, the preliminary list of 41 indicators had five indicators deleted and retained 36 indicators. Some of the deletions included:
This is also because of the low authority and reliability of their statistical data sources. Number of sports organizations (D9), number of sports websites (D12), and urban residents’ disposable time (D27).
Students majoring in physical education, replaced with the number of students in ordinary colleges and universities, as most sports colleges and universities in the model prefecture-level cities concentrate in Shenyang, Dalian, and other large cities, making the indicator unpersuasive for other cities.
Total urban population (D30) was considered redundant as it significantly duplicated total regional population (D29).
The indicators retained after preliminary screening are listed in Table 2.
| Level I indicators | Secondary indicators | Index name and number | Company |
|---|---|---|---|
| Supply potential | Supply inherent potential | Gross regional product (D1) | RMB100mn |
| Scale of sports industry (D2) | RMB100mn | ||
| Number of employees in sports industry (D3) | People | ||
| Number of sports industry policies (D4) | Individual | ||
| The government’s position on the sports industry (D5) | Nothing | ||
| Policy support for sports industry (D6) | Nothing | ||
| Supply expansion potential | Number of site facilities (D7) | Individual | |
| Area of site facilities (D8) | Square meter | ||
| Number of patents granted (D9) | Individual | ||
| Scientific research investment (D10) | Zhang (volume) | ||
| Number of athletes above level 2 (D11) | Individual | ||
| Number of referees above second level (D12) | Individual | ||
| Number of international and national sports events held (D13) | Individual | ||
| Number of medals won in international and national sports events (D14) | Individual | ||
| Demand potential | Demand inherent potential | Number of social sports instructors (D15) | Individual |
| Population of mass sports (D16) | Individual | ||
| Sales of sports lottery (D17) | RMB100mn | ||
| Community Health Service Agency (D18) | Individual | ||
| Participation rate of residents in sports and fitness activities (D19) | Percentage | ||
| Satisfaction rate of residents’ physical fitness activities (D20) | Percentage | ||
| Awareness rate of residents’ physical fitness activities (D2) | Percentage | ||
| Demand supporting potential | Per capita disposable income in cities and towns (D22) | Element | |
| Urban per capita consumption expenditure (D23) | Element | ||
| Savings of urban residents (D24) | Element | ||
| Total regional population (D25) | Individual | ||
| Integration potential | Tourism integration potential | Annual number of tourists received (D28) | 10000 person times |
| Total tourism income (D29) | RMB100mn | ||
| Annual days of good air quality (D30) | Day | ||
| Number of cultural venues (D31) | Individual | ||
| Cultural integration potential | Number of people under the Culture, Sports and Entertainment Act (D32) | Individual | |
| Individual households in culture, sports and entertainment industry (D33) | Individual | ||
| Types of newspapers, periodicals and books (D34) | species | ||
| Number of cable TV households (D35) | 10000 households | ||
| Number of mobile phone users (D36) | 10000 households |
Significant differences exist in various regions in China in terms of social and economic development. These differences have been shown to exist in different fields, such as infrastructure construction, the urbanization process, social governance, and industrial structure. At the same time, these disparities somewhat limit the upgrading of the mass consumption structure and the expansion of service consumption [13-16].
In the proposed system, the process is not sharing individual models. Instead, local models from each user are integrated into a centralized black-box model. This black box model is a meta-structure provided for the users by the cloud server. Users are not allowed to view the inside structure of the model but instead, can input data and receive outputs. In this regard, it adds further security to the data and prevents intermixing of different users’ data through the local model. In this approach, the regional industrial structure analysis is done with the most accurate precision. System structure diagram Figure 7.
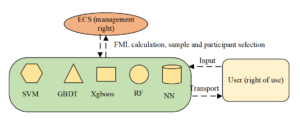
Although the virtual label R will be ignored in the global maximum model prediction problem and the calculation of FLM, adding (x,R) to the training will reduce hi−(x,y−), because the trained hi− will be more inclined to mark the sample x as R. The process is shown in Figure 8.
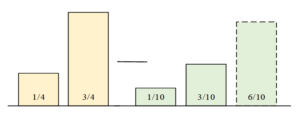
Industrial layout by using Kronbach coefficient method. It can be seen from the analysis that Cronbach’s Alpha=0.945 > 0.9 in the first round of expert consultation in this study shows that the questionnaire designed in this survey has high reliability, as shown in Table 3 and Table 4.
| Cronbach’s alpha | Number of items |
|---|---|
| 0.945 | 44 |
| Indicator layer D | Shenyang | Dalian | Anshan | Fushun | Benxi | Ying Kou | Fuxin | Liaoyang | Tieling | Dandong | Jinzhou | Panjin | Huludao | Chaoyang |
|---|---|---|---|---|---|---|---|---|---|---|---|---|---|---|
| GDP (100 million yuan) D1 | 7281 | 7731.7 | 2348 | 1216.6 | 1164.62 | 1513.9 | 542.2 | 1029.3 | 740.8 | 984.8 | 1357.6 | 1267.8 | 720.3 | 862.8 |
| Sports industry scale (100 million yuan) D2 | 186.7 | 201.3 | 93.5 | 10 | 10.59 | 10.82 | 11.28 | 11.9 | 7.5 | 10.7 | 13.3 | 10.9 | 7.5 | 3.3 |
| 3.3Number of employees in sports industry (person) D3 | 30168 | 30072 | 11325 | 6322 | 5759 | 8904 | 5021 | 5010 | 6018 | 6323 | 7097 | 6038 | 5862 | 6816 |
| Number of sports industrial policies (nos.) D4 | 1 | 4 | 1 | 1 | 1 | 1 | 1 | 1 | 1 | 1 | 1 | 1 | 1 | 1 |
| The government’s position on the sports industry D5 | Football City Sports Core Area | Blue sports core area of foot, volleyball, tennis and swimming | Military feather | Bing pang, Jian | Blue ball, soldier feather, net | Volleyball, swimming | Basketball City | Bodybuilding | Tennis, health | Blue and volleyball badminton sports business core | Football | Swimming | ||
| 1 | 4 | 2 | 2 | 4 | 2 | 1 | 1 | 0 | 2 | 3 | 1 | 1 | 0 | |
| Number of venues D6 | 9514 | 9572 | 3644 | 2095 | 1172 | 1718 | 3245 | 1768 | 3015 | 2285 | 2614 | 1658 | 3118 | 2452 |
| Per capita facility area (m2) D7 | 1.3 | 2.48 | 1.59 | 1.17 | 1.39 | 2.17 | 1.52 | 1.27 | 1.46 | 1.83 | 1.77 | 2.2 | 1.95 | 1.23 |
| Number of athletes above level 2 D8 | 185 | 174 | 190 | 163 | 179 | 205 | 192 | 214 | 218 | 207 | 183 | 177 | 208 | 234 |
| Number of referees above Grade II D9 | 146 | 106 | 77 | 57 | 99 | 180 | 166 | 72 | 97 | 146 | 132 | 99 | 136 | 180 |
| Number of medals in major sports events D10 | 213 | 325 | 99 | 25 | 190 | 148 | 139 | 252 | 69 | 278 | 124 | 37 | 22 | 122 |
| Number of community sports instructors (10000 persons D11 | 2.2 | 2.1 | 1.3 | 0.7 | 0.5 | 0.5 | 0.6 | 0.5 | 0.4 | 0.3 | 0.6 | 0.3 | 0.3 | 0.2 |
| Number of annual patents granted D12 | 9035 | 7182 | 2289 | 617 | 284 | 997 | 628 | 82 | 528 | 554 | 1147 | 1290 | 563 | 197 |
| Scientific research investment (100 million yuan) D13 | 201 | 186 | 114 | 28 | 106 | 16.7 | 106 | 8.7 | 20 | 23 | 88 | 59 | 44 | 22 |
| Number of mass fitness activities D14 | 2400 | 1011 | 925 | 794 | 293 | 794 | 295 | 42 | 828 | 602 | 458 | 32 | 42 | 248 |
| 358S234ales volume of sports lottery (100 million yuan) D15 | 14.47 | 17.6 | 2.2 | 1.2 | 0.66 | 1.2 | 1.37 | 1.2 | 2.2 | 1.4 | 1.37 | 1.7 | 1.9 | 1.8 |
| Community health service institutions D16 | 137 | 128 | 24 | 120 | 36 | 100 | 113 | 69 | 121 | 87 | 25 | 74 | 92 | 84 |
| Participation rate of residents in sports and fitness activities (percentage) D17 | 72.3 | 68.8 | 53.8 | 42.7 | 44.8 | 50.2 | 55.8 | 37.6 | 57.8 | 35.5 | 43.3 | 30.3 | 62.5 | 53.3 |
| Residents’ satisfaction with sports and fitness activities (percentage) D18 | 73.2 | 81.5 | 61.5 | 55.7 | 49.6 | 52.7 | 47.8 | 46.6 | 43.8 | 43.2 | 49.8 | 43.8 | 42.8 | 42.8 |
| Residents’ awareness of sports and fitness activities (percentage) D19 | 83.8 | 68.6 | 53.5 | 49.6 | 30.5 | 47.8 | 50.3 | 54.9 | 44.8 | 43.6 | 47.3 | 42.6 | 45.6 | 40.4 |
| Urban per capita disposable income (yuan) D20 | 36644 | 35888 | 29944 | 26819 | 27722 | 30459 | 22663 | 26388 | 20692 | 24725 | 27042 | 32468 | 24769 | 21221 |
| Urban per capita consumption expenditure (yuan) D21 | 25872 | 25825 | 23685 | 18369 | 19742 | 20250 | 19738 | 18928 | 13584 | 16316 | 19752 | 23569 | 15522 | 11350 |
| Savings of urban residents (100 million yuan) D22 | 14035.5 | 13865.4 | 1956.9 | 1078.9 | 762.8 | 23132 | 622.9 | 878.8 | 809.5 | 1239.8 | 1200.5 | 863.5 | 975.9 | 1036 |
| Total regional population (10000 persons) D23 | 829.2 | 594.7 | 347 | 215.9 | 151.3 | 232.7 | 177.9 | 179 | 301.5 | 239.3 | 302.7 | 129.5 | 280.3 | 340.8 |
| Number of students in Xiang tong University (10000) D24 | 44.9 | 33.2 | 3.6 | 4.5 | 2.4 | 0 | 4.6 | 0.6 | 2 | 2.9 | 8.6 | 0.8 | 0.8 | 0.5 |
| Number of vertical scenic spots (No.) D25 | 75 | 52 | 23 | 23 | 21 | 18 | 13 | 13 | 11 | 27 | 27 | 14 | 22 | 36 |
| Annual number of tourists received (10000 person times) D26 | 9219.3 | 6829.3 | 5049 | 2696.8 | 2305.8 | 2112.6 | 1007.2 | 1949.6 | 1704.9 | 3889 | 2078.3 | 2005.2 | 1829.5 | 1716 |
| Total tourism income (100 million yuan) D27 | 1222.3 | 1009.8 | 553 | 223.6 | 242.8 | 186.2 | 69.4 | 159.4 | 117.2 | 512.8 | 154.2 | 169 | 147 | 129.9 |
| Annual days of good air quality (days) D28 | 208 | 272 | 234 | 262 | 275 | 245 | 268 | 249 | 253 | 306 | 245 | 262 | 345 | 304 |
| Number of cultural venues D29 | 51 | 45 | 23 | 18 | 16 | 20 | 23 | 38 | 24 | 21 | 16 | 19 | 38 | 44 |
| Number of people in culture, sports and music laws (number) D30 | 1814 | 1647 | 726 | 285 | 345 | 333 | 552 | 195 | 260 | 452 | 1013 | 305 | 407 | 472 |
| Number of Individual Households of Culture, Sports and Houle Industry (Nr.) D31 | 3193 | 1407 | 607 | 795 | 568 | 547 | 1645 | 355 | 644 | 734 | 1289 | 395 | 853 | 735 |
| Types of Paper, Periodicals and Books D32 | 66 | 54 | 16 | 8 | 6 | 9 | 10 | 16 | 9 | 7 | 15 | 4 | 5 | 5 |
| Number of cable TV households (10000 households) D33 | 279 | 227 | 82 | 20 | 16 | 57.1 | 16 | 18.7 | 18 | 33 | 59.2 | 29 | 42 | 61 |
| Number of mobile phone users (10000) D34 | 1349.4 | 726.3 | 335.2 | 201 | 166 | 203.2 | 139.9 | 186.2 | 226 | 196.5 | 222.7 | 175.6 | 200.6 | 179 |
The coordination degree of opinions expressed by experts on the sports industrial structure and industrial layout model is tested to determine whether experts’ opinions are consistent. Coordination degree among experts refers to how well aligned different experts are in opinions on the same issue. Generally, a high degree of consistency among experts shows that the resultant is very close to the actual situation.
The W coefficient ranges between 0 and 1 and evaluates the consistency of expert opinions. With a higher W value closer to 1, the coordination process among experts receives high levels of assessment, which in turn provide more accurate outcomes for the system of the indicator. The results of the coordination degree analysis are presented in Table 5.
| Round | Coordination coefficient (Kendall Wa) | Chi square | P value |
|---|---|---|---|
| First round | 0.236 | 118.523 | 0.000 |
| Second round | 0.247 | 113.169 | 0.000 |
From the Table 5, it is shown that the p-value for two rounds of W coefficient tests is strong at p = 0.000 < 0.05. This therefore indicates that the various assessments are highly consistent. Again, the W coefficients for both rounds are 0.235 and 0.246, respectively, which lie between 0–1. This also gives a high evaluation consistency scale.
The coefficient of variation reflects the dispersion of experts’ evaluations. For all the indicators, a high coefficient of variation mostly speaks of a level of insufficient coordination. Having analyzed data from the first round of expert consultation, it was determined that the coefficient of variation for all the indicators was less than 0.2, so no indicators were deleted at this stage. In addition, indicators with an average value of less than 4 were treated as being of average importance and marked as having to be further probed during the second round. Details are given in Table 6, where * indicates those with an average value of less than 4.
| Index | Mean value | Standard deviation | Coefficient of variation |
|---|---|---|---|
| 1. Basic competitiveness | 4.68 | 0.493 | 0.12 |
| 2. Resource competitiveness | 4.68 | 0.493 | 0.12 |
| 3. Environmental competitiveness | 4.09 | 0.794 | 0.20 |
| 4. Core competitiveness | 4.76 | 0.623 | 0.14 |
| 1.1 Economic development level | 4.93 | 0.288 | 0.07 |
| 1.2 Living standard of residents | 4.59 | 0.516 | 0.12 |
| 2.1 Human Resources | 4.43 | 0.902 | 0.22 |
| 2.2 Transportation resources | 4.34 | 0.652 | 0.16 |
| 2.3 Infrastructure resources | 4.76 | 0.453 | 0.11 |
| 3.1 Supporting capacity of relevant industries | 4.43 | 0.516 | 0.13 |
| 3.2 Government input | 4.18 | 0.719 | 0.18 |
| 4.1 Industrial scale | 4.52 | 0.523 | 0.13 |
| 4.2 Industrial structure | 4.43 | 0.516 | 0.13 |
| 4.3 Industrial benefits | 4.84 | 0.392 | 0.09 |
| 4.4 Industrial characteristics | 4.84 | 0.392 | 0.09 |
| 4.5 Industrial cooperation | 4.18 | 0.719 | 0.18 |
| 1.1.1 GDP per capita | 4.34 | 0.652 | 0.16 |
| 1.1.2 GDP growth rate | 4.09 | 0.516 | 0.14 |
| 1.2.1 Proportion of per capita sports consumption in disposable income | 4.43 | 0.516 | 0.13 |
| 2.1.1 Proportion of urban population | 4.02 | 0.604 | 0.16 |
| 2.1.2 Number of college students | 3.68 | 0.652 | 0.19 |
| 2.2.1 Road density | 4.02 | 0.738 | 0.19 |
| 2.2.2 Railway density | 3.93 | 0.670 | 0.18 |
| 2.3.1 Sports ground area per capita | 4.59 | 0.516 | 0.12 |
| 2.3.2 Number of sports venues per capita | 4.43 | 0.668 | 0.16 |
| 3.1.1 Domestic tourism income | 4.09 | 0.794 | 0.20 |
| 3.12 Value added of cultural industry | 4.09 | 0.516 | 0.14 |
| 321 Proportion of cultural, sports and entertainment expenditure in financial expenditure | 4.52 | 0.523 | 0.13 |
| 322 Actual use amount of sports lottery public welfare fund | 4.01 | 0.604 | 0.16 |
| 4.1.1 Total scale of sports industry | 4.59 | 0.516 | 0.12 |
| 4.1.2 Added value of sports industry | 4.68 | 0.493 | 0.12 |
| 4.1.3 Number of legal entities in sports industry | 4.34 | 0.652 | 0.16 |
| 4.2.1 Proportion of added value of sports industry in GDP | 4.34 | 0.652 | 0.16 |
| 4.2.2 Proportion of total scale of sports service industry | 4.43 | 0.516 | 0.13 |
| 4.31 Contribution rate of sports industry to economy | 4.43 | 0.670 | 0.16 |
| 4.3.2 Contribution of sports industry to employment | 4.52 | 0.523 | 0.13 |
| 4.4.1 Number of national sports industry bases | 4.18 | 0.719 | 0.18 |
| 4.4.2 Number of sports tourism featured projects | 4.43 | 0.670 | 0.16 |
| 4.51 Number of sports industry cooperation policy documents | 4.43 | 0.670 | 0.16 |
| 4.5.2 Number of sports events, leisure activities and summit forums jointly held by the urban agglomeration | 4.26 | 0.755 | 0.19 |
To measure the performance of the algorithm, 20 different random seeds were prepared for multiple experiments, and the range of variation is plotted on the variation curve. In the experimental testing of the algorithm, first, the system calibration process was tested to evaluate the working state of the system under six Non-IID scenarios using the Fashion MNIST dataset. The detailed information of the scenario setting is given in Table 7.
The experimental setup was set with a maximum number of sample corrections in an iterative process set to 100, the number of clients to 10, and heterogeneous models assigned to local users. The models included six 3-layer convolutional CNN networks optimized using SGD (learning rate of 0.01), one SVM, one GBDT, one Boost, and one RF. On the client side, local models were preheated for 10 epochs with the local model, and the locally generated models were preheated for 50 epochs using local data. The initial state of the local model preheating is shown in Table Table 7. The entire experiment was repeated with different random seeds for 10 trials.
| Scene NameNumber of | Customers | Data division | Correction times | Local model | Generator |
|---|---|---|---|---|---|
| IID | 10 | IID Settings | 100 | CNN, CNN, | W-GAN |
| Non IID A | 10 | 9 Label equalization | 100 | CNN, CNN, | W-GAN |
| Non IID B | 10 | 7 Label equalization | 100 | CNN, CNN, | W-GAN |
| Non IID C | 10 | 7 Label equalization | 100 | SVM, GBDT, | W-GAN |
| Non IID D | 10 | 5 Label equalization | 100 | XG Boost, Random | W-GAN |
| Non IID E | 10 | 2 Label equalization | 100 | Forest | W-GAN |
Under different scenarios, the precision change curves of the sports industrial structure and industrial layout model system are shown in Figures 9 and 10.
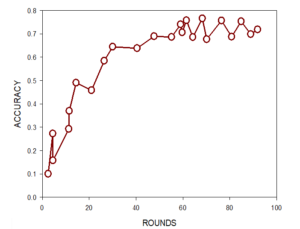

The key to fostering the effective integration of the sports industry with urban development lies in considering spatial and temporal dynamics, such as the characteristics of the sports industry and urbanization, in order to encourage high-quality development. Through the spillover effects of technological innovation and industrial integration, the interaction between the sports industry and urbanization can reach a synergistic relationship. Growth factors, thus, may advance urbanization through their flow.
In a comparative experiment on generation model selection, appropriate epochs and choosing the right generation model gave the researchers a balance between computational effort and accuracy. Concerning communication costs, traditional federated learning’s aggregation demand results in more communication models, which clearly, significantly increases traffic compared to approaches such as sample sharing and FedEG. FedEG, through its purposeful correction process, increases the accuracy and specificity of sample selection and transmission. Hence, FedEG represents lower traffic consumption than the sample sharing strategy.
The experimental data used to support the findings of this study are available from the corresponding author upon request.
The author declares no conflict of interest regarding this work.