
Higher standards have been set for new energy vehicles’ safe and intelligent driving control systems due to their ongoing research and use [1]. In the field of automotive intelligent driving, image processing technology is becoming more and more significant, particularly in the study and use of visual perception [2,3]. This study presents a new energy vehicle driving control system based on image processing technology [4]. It realises the tasks of road element detection, path planning, and vehicle navigation by using real-time processing and analysis of road images.
One of the most significant approaches to addressing the energy issue and environmental degradation is the development of new energy vehicles [5]. New energy cars do, however, have numerous difficulties when driving, including precise navigation in intricate road settings and safe driving. Thus, it is imperative to conduct research and build an intelligent driving control system in order to enhance the driving experience, safety, and comfort of new energy cars [6].
As a potent tool for perception, image processing technology can convert information about the vehicle’s surroundings into digital data, giving it the information support it needs to drive intelligently. Real-time road element recognition and analysis can be achieved by the processing and analysis of road photographs. This will enable drivers to make more informed driving decisions by giving them access to more thorough and accurate road information [5,7].
Nevertheless, there are several difficulties with the image processing-based new energy vehicle driving control system. First, the intricacy of the road environment, including shifting lighting and blurring of road signs, makes processing and analysing road photos more challenging and complex [6]. Second, the system must make accurate judgements and replies quickly in order to be both real-time and accurate. This places more demands on the algorithm’s stability and efficiency [8]. Furthermore, identifying and categorising various road aspects is difficult and necessitates the development of appropriate feature extraction and classification algorithms in order to produce correct recognition and classification [5].
This research proposes an image processing-based new energy vehicle driving control system with the following benefits: First, it achieves efficient processing and segmentation of road images and enhances the system’s stability and applicability in various conditions by utilising the enhancement techniques of threshold segmentation and adaptive thresholding [9]. Second, accurate recognition and categorization of road elements are realised by sample type characterisation and secondary feature extraction, which offers dependable support for vehicle intelligence. Ultimately, the vehicle’s navigation is realised through image gathering, preprocessing, boundary extraction, road centerline fitting, and path planning. This enhances driving comfort and safety while offering drivers precise navigational direction [10].
The image processing technology-based new energy vehicle driving control system has significant research relevance, real-world application value, and a wide range of potential uses in addressing safety and intelligence issues in new energy vehicle driving.
Threshold segmentation, which divides the pixels into two categories by comparing each pixel point’s grey value in the image with a predetermined threshold value, is utilised in this study [11]. The road background in this paper is blue, the road edges are black, and the road pavement appears white. The road pavement’s grey value differs significantly from other objects’ grey values in comparison [12]. Thus, by splitting the road image into two sections—the road surface (target) and other items (background), the study seeks to differentiate the road surface from other objects (such as road boundaries, background, barriers, etc.). The following describes the precise threshold segmentation computation procedure [13]:
\[\label{e1} \operatorname{Data}(n, m)= \begin{cases}0, & \text { Data }(n, m)<\text { GrayThreshold }, \\ 1, & \text { Data }(n, m) \geq \text { GrayThreshold }.\end{cases} \tag{1}\]
GrayThreshold is the threshold value that is currently in use, where Data\((n,m)\) is the picture matrix. Selecting the right threshold value is essential to the threshold segmentation procedure. A threshold that is set too high could lead to more interference information, whilst a threshold set too low could result in less road edge information. As a result, cautious observation and discernment are needed, and suitable thresholds must be established using various auxiliary tools or by analysing the data from the histogram. To determine the optimal value that satisfies the experimental conditions, researchers must continuously interact and experiment with different thresholds [14]. The edge information, or target information, of the road pavement is the primary feature of the road image in this study. Thus, our objective is to efficiently segment the road edge data and remove interference. In order to achieve this, we utilised the road image to perform grey level histogram statistics; the outcomes are displayed in Figure 1.
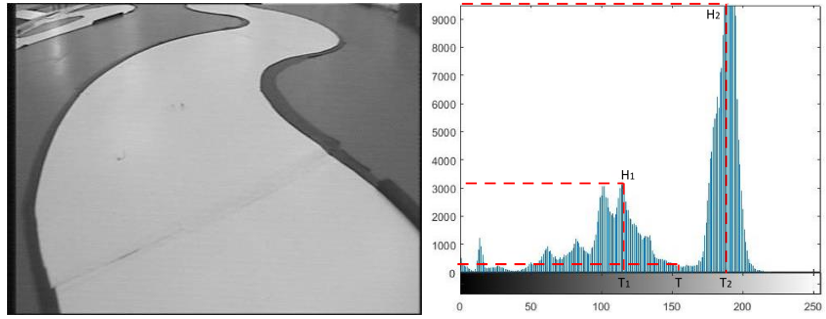
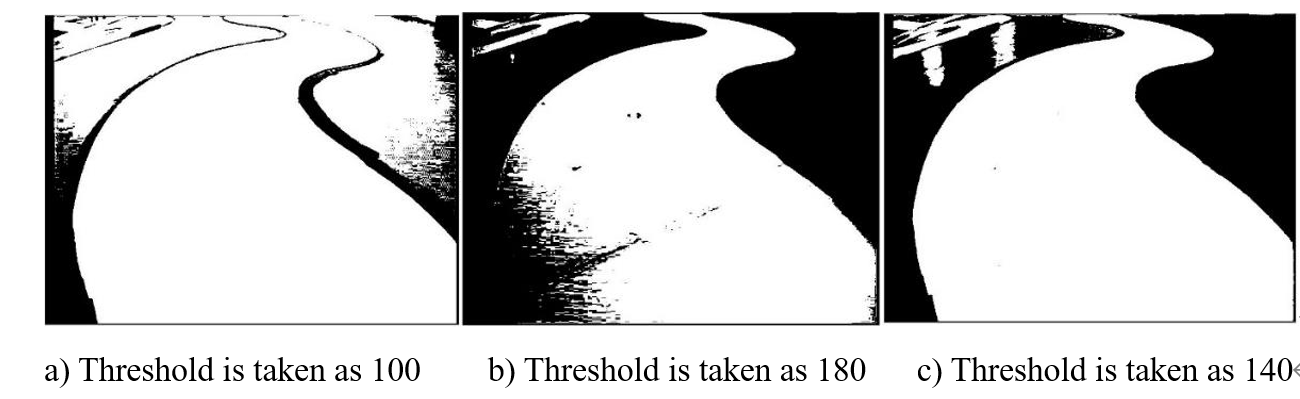
Less grayscale statistics should be found along the road boundaries and more in the background, according to an analysis of the histogram’s statistical data. It is evident from the statistical graph that the background portion should contain the highest peak. Further investigation reveals that the threshold ought to be set at the peak and valley between the highest peak and the left peak, or on the left side of the peak. Until we determine the ideal segmentation value, we can experiment with other thresholds. Manual iteration is another name for this process [15]. Our experience indicates that the threshold value should be approximately \(T=150,\) and that it should then be modified based on the particular circumstances. The experimental results are shown in Figure 2.
Based on the aforementioned experimental effect photographs, we may discern the target from the background by selecting a threshold value of T=180; however, noise will still be present. As a result, we think that T\(<\)180 should be the cutoff value.Furthermore, the target part has been over-separated when the threshold value T=100 is chosen, leading to the loss of road edge information. As a result, we think that T\(>\)100 should be the threshold value. After doing numerous tests and modifications, we ultimately determined that T=140 was the threshold value. The interference can be successfully filtered away at this threshold value, leaving the target and background distinct from one another. Consequently, the ideal threshold is established at this value.
The aforementioned approach uses manual analysis to calculate the global threshold; nevertheless, its usefulness is restricted. It is required to remeasure the environmental feedback image and recalculate the threshold value whenever the environment changes (for example, when light intensity changes). The technology in the smart driving car ought to be able to recognise and navigate through various environments on its own. To improve the system’s applicability, an enhanced adaptive threshold selection mechanism is suggested. Through examination of the road and image, we discovered that the background and road have comparatively uniform grayscale distributions, and the grayscale histogram of the image clearly displays a bimodal distribution. In order to increase the system’s adaptivity, we therefore choose to use the peaks and valleys between the two highest peaks as the threshold value.
This algorithm’s core idea is to first compute the histogram statistics of each image’s grey values. Then, using the lookup approach, it finds the peaks of two primary peaks, H1 and H2, which correspond to the grey values T1 and T2, respectively.Next, in the interval between [T1, T2], the grey value T, which corresponds to the lowest peak and valley between the peaks, is determined. T is then used as a segmentation threshold to categorise the image’s pixels. Figure 2 displays the adaptive thresholding method.
This study defines GrayThreshold as the threshold that is now in use, Pre_grayThreshold as the threshold that was last used, and Init_grayThreshold as the manual threshold. The following is the general flow of threshold tracking:
Step 1: By manually examining and analysing the first image, determine an appropriate threshold Init_grayThreshold.
Step 2: The adaptive law computes the current threshold GrayThreshold.
Step 3: By comparing the difference between Pre_grayThreshold and GrayThreshold, one can determine if GrayThreshold is currently used as the threshold or Pre_grayThreshold. If the absolute value is less than the empirical value G (G=16 is used in this system) or the empirical value of two times of G when comparing the difference between Init_grayThreshold and GrayThreshold, GrayThreshold is currently used as the threshold. In all other cases, the current threshold is Pre_grayThreshold.
Step 4: Pre_grayThreshold is the current threshold when the adaptive threshold cannot be computed (no value).
According to the aforementioned procedure, the threshold value is updated continually, and at this point it is also referred to as the dynamic threshold value. This means that every image uses a newly established threshold value as the segmentation criterion. The system is highly adaptable to various lighting conditions; in fact, it can determine the appropriate threshold value based on the distribution structure of the grey level histogram in any given environment.
Road elements, which are specified and represent sample kinds in the feature space, include straight roads, curves, crossroads, obstacles, ramps, etc. in this intelligent driving control system. Road element feature extraction is the process of extracting the corresponding feature portion from the road image to describe the various sample kinds based on their characteristics. Supervised learning is another name for this pattern training procedure because the machine knows the sorts of samples.
Following edge detection, this system extracts edge information. Several features are obtained after secondary feature extraction, including the following:
Route left edge characteristic \({X_1}\). The continuous line shape of the stored left edge fit may be continuous or intermittent depending on whether the road’s left edge collection exists.
Side of road feature \({X_2}\) on the right. The fitted line on the right edge of the road may be in an intermittent or continuous scenario since the right edge is collected in the same manner as the left edge.
Centerline curvature characteristics. There will be sporadic lines since the centerline is drawn from the left and right margins of the road; nonetheless, the curve of the centerline provides more significant information.
Characterization of the left and right borders \({X_7}\) in terms of distance. Based on the difference between the existing left and right borders, the left and right boundary distances can be created.
Features of edge length \({X_8}\). When the edge is straight, its length can be determined by comparing it to the entire edge.
The sample road elements—straights, curves, crossroads, obstacles, ramps, and right-angle turns—are described by the aforementioned characteristics in the context of the secondary feature extraction mentioned above.
Features of the straight channel class \({W_1}\) include a centerline curvature of \(|\theta | \leqslant {30^ \circ }\) and present and uninterrupted left and right edges.
Bend class features: bend features include potential loss of left and right edges on one side. radius of the centerline \(|\theta | \geqslant {30^ \circ }\) centerline curvature \({3^ \circ } \leqslant |\theta | \leqslant {30^ \circ }\) in the case of a \({W_2}\) bend. centerline curvature in the case of a \(|\theta | > {30^ \circ }\) bend.
Features of a crossroads class \({W_4}\) include missing left and right margins, a straight and interrupted centerline that extends about the width of the road, and a centerline curvature of \(|\theta | \leqslant {30^ \circ }\) .
Ramp class \({W_5}\) feature: the length of the image edge c is slightly shorter when travelling uphill, but otherwise, the ramps remain unaltered in terms of the road alignment in the longitudinal section.
Challenge \({W_6}\) Features: the road obstacle is confined to one side of the road, and its edge is also identified as the road edge during the road detection process. Consequently, both the left and right edges of the road are present at that location, the distance d between the left and right edges of the road narrows, and the centerline’s curvature is \(|\theta | \geqslant {30^ \circ }\) .
This approach uses samples of road elements with known conditions; that is, the process of fitting linear or discrete functions of X and Y can be understood as training the classifier with known input \(X\) and output \(Y.\) The block diagram presented in Figure 3 illustrates the training procedure.

A Sony CCD analogue camera and a USB 2.0 video capture stick EasyCAP were connected to create the field of view of the new energy vehicle in order to make the study and visualisation of the image processing algorithms easier. After that, Honestech VHS to DVD 2.0 software was set up on a PC and used to read the video stream. MATLAB 2015b was used for image processing and simulation, and C was used to write the algorithms that applied to the smart car platform. Lastly, a download to the smart car for testing was made via J-Link. Figure 4 depicts the acquisition procedure in its entirety.
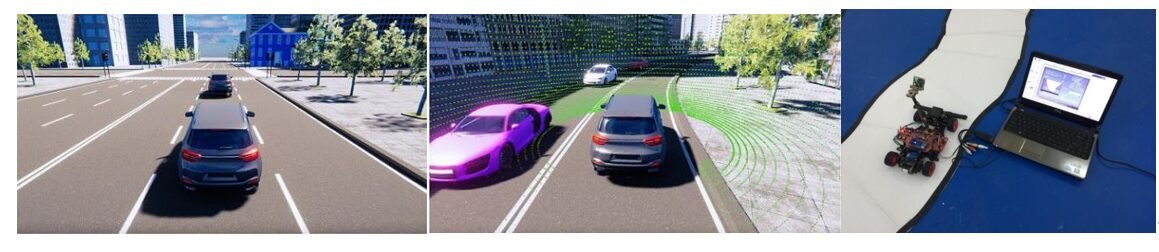
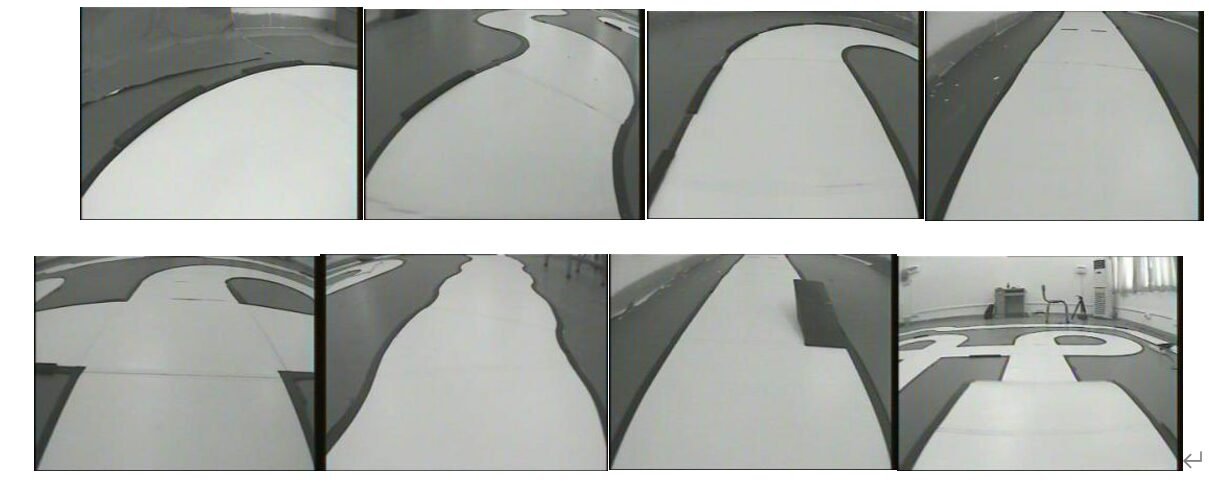
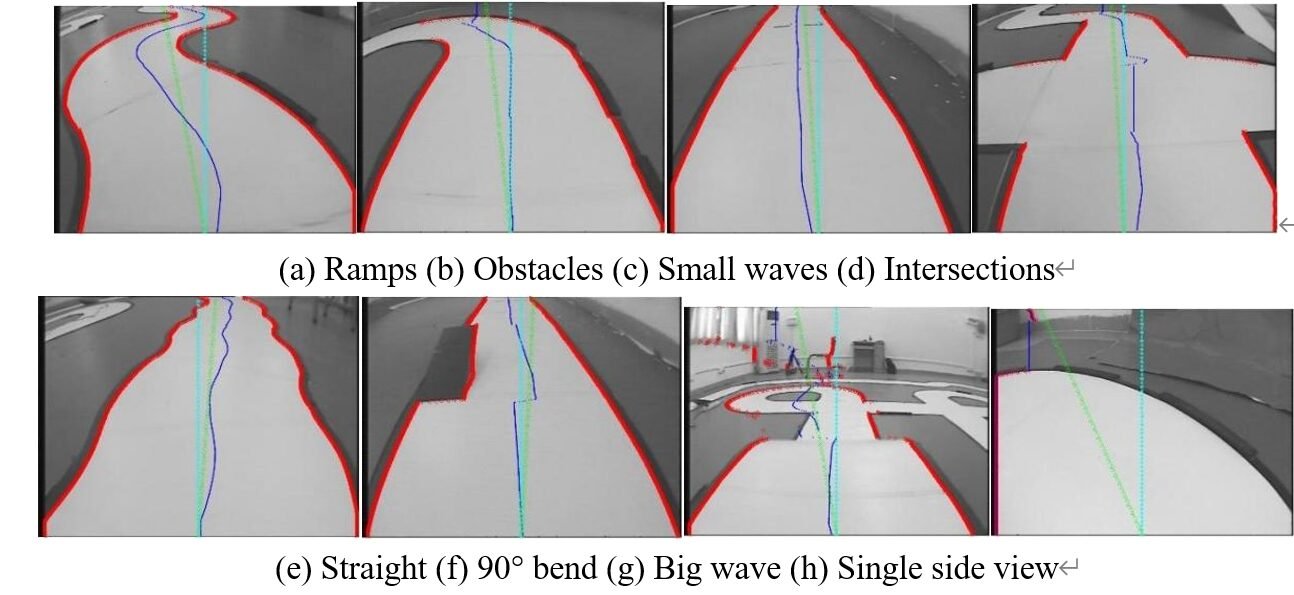
We were able to successfully record the visual perception of the new energy vehicle to the road information by connecting the PC to the CCD camera seen in Figure 5. As seen in Figure 5, we intercepted some photos during the experiment that showed, in that order, ramp, obstacle, tiny wave, intersection, straight road, \({90^ \circ }\) corner, big wave, and one-sided field of view. One-sided vision is more common when driving, particularly in surroundings of the \(\Omega\), \(S\), \(n\), and circular types, which are nearly always encountered despite variations in the curved curves’ radius of curvature.
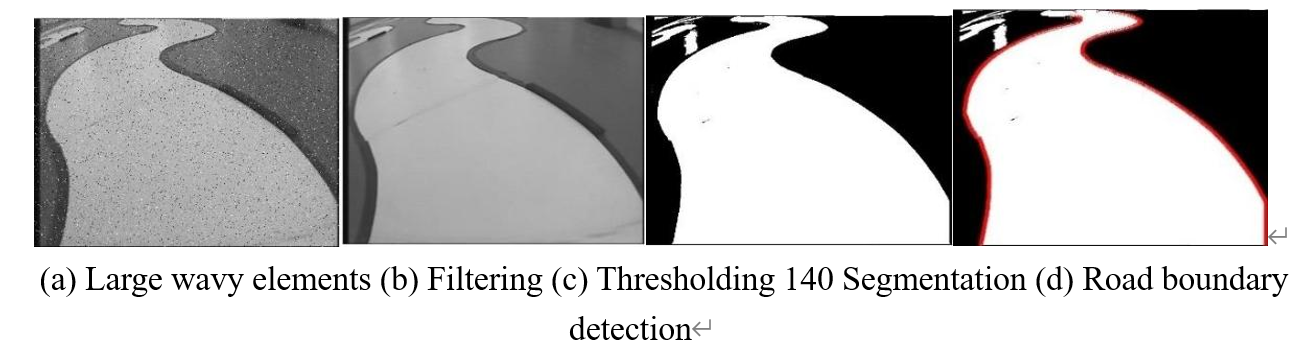
An enhanced median filtering algorithm is used to the grayscale image of a big wavy road (Figure 6). The algorithm first evaluates if each pixel point is extreme or not, and then it performs image purification. The outcome is displayed in Figure 6. By examining the picture histogram, the system determined the dynamic threshold GrayThreshold = 140. It then carried out threshold segmentation using the formula to produce Figure 6. After that, the myopic region’s stable boundary information was obtained by scanning from the middle. Following the scanning of the first seven rows, boundary tracking monitoring was carried out using the technique of expanding the left and right by 30 pixel points. The road’s boundary information was extracted and labelled independently throughout the boundary information collecting process thanks to the application of the enhanced Prewitt method in Figure 4, which raised the boundary width’s feature parameters (Figure 6).
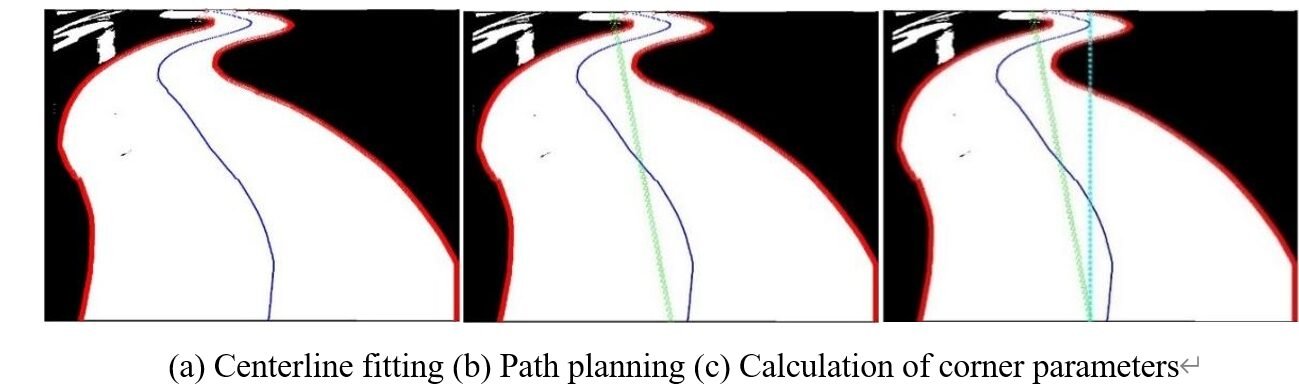
The procedure outlined in Section 4.2 is used to fit road centerlines. First, it determines whether there are any bilateral road boundaries. If so, points are taken at the intersection of the two boundaries; if there is just one, the points are supplemented; and if there isn’t a boundary, the last centerline is followed. The fitting effect is displayed in Figure 7, where the vehicle travel path guide is the centre of the travel lane, where the centerline is situated. The horizontal distance from point a to the absolute centerline is computed as the midpoint b by finding the maximum left and right fluctuation point an of the centerline (based on the absolute centerline l of the image, and the midpoint of the first row is o). Next, a straight line is drawn across points b and o, and the vehicle’s current path is determined by following the straight line. The driving path is optimised using this strategy, as Figure 7 illustrates.
Using the edge of the road surface as the boundary information, the centerline of the road surface in the middle of the runway, the vertical vertical line as the longitudinal axis of the camera, and the diagonal straight line as the path planning line, the method is used to extract the boundary, fit the centerline, and plan the path for the road elements. According to Figure 8.
During the experiment, we were able to identify the vehicle’s positional deviation and transmit the data in real time to the host computer for observation. Beginning at position 0, the vehicle measured the distance every 0.5 metres and transmitted the corner data to the host computer. The wheels’ revolution count was tracked, and the position was sent at 0.5 m intervals by transmitting a cornering data at the appropriate revolution count. We were able to get the results depicted in Figure 9 by data collection and graphing.
In order to measure the data for the experiment, we set the vehicle’s speed to 1.5 m/s, 2 m/s, and 2.5 m/s. The data analysis revealed that the offset value is not significantly affected by the vehicle’s speed when travelling in a straight line. On the other hand, as the vehicle speed increases during a turn, the inertia increases. Because of this, even if the car brakes in time, it will still deflect somewhat. Increasing the turning angle is required to modify the body position and change the direction of the vehicle. This adjustment phenomena is typical and shows that the effort required for adjustment increases with vehicle speed.
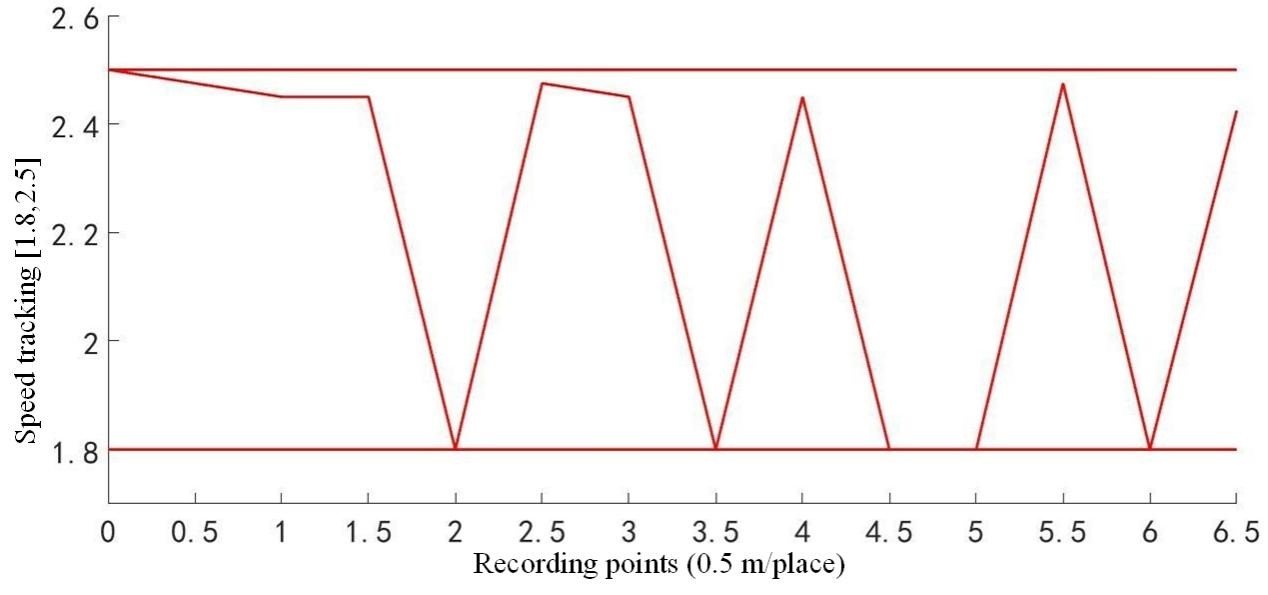
With a test distance of 6.5 m and a corner range of [-45, 45], experiments were carried out for three different speed levels. The speed range was restricted to [1, 1.5], [1.5, 2], and [1.8, 2.5], respectively. The Fuzzy-PID algorithm was utilised to regulate the velocity tracking inputs, and the system’s velocity inputs were found by fitting and calculation. As observed in Figure 10, the figure illustrates how the speed varies in proportion to changes in the corner.
This paper presents a new energy vehicle driving control system based on image processing technology. Through the processing and analysis of road images, the system is able to recognise road objects, plan a route, and calculate parameters related to vehicle direction and speed. The best threshold is found by hand iteration during the system design and experimental validation phases. The adaptive threshold improvement method is suggested to increase the system’s stability and applicability in various contexts. Through secondary feature extraction and sample type characterization, the system achieves accurate recognition and classification of various road elements. It also performs feature extraction and classification of road elements, including sample types such as straight roads, curves, intersections, obstacles, and ramps. Experiments are used to validate the system’s precise calculation and management of vehicle speed and cornering, ensuring the stability and safety of the vehicle at all speeds and cornering situations. In order to fulfil the expanding need of the new energy vehicle market, the algorithm and system design can be further optimised in the future to increase the system’s intelligence and flexibility.
This work was supported by Guangdong Province Key Field Special Project for Ordinary Universities (2022ZDZX3077).